Traders with successful investing and trading strategies require access to reliable and up-to-date information about markets. FinViz is an online stock screener that can be used in a variety of different ways. The screener enables traders to track the price movements of specific stocks and further monitor various signals and indicators. While the platform is not without its fair share of drawbacks, it is a useful resource for both new and experienced traders.
The FinViz Stock Screener: What You Need to Know
As a relatively comprehensive stock screener, FinViz can be applied to many different trading strategies. The screener makes it easy for traders to compare stocks across different markets, timeframes, and key indicators.
Stock screeners and related platforms are often among the useful tools in a trader’s toolbelt. These programs make it possible for investors to quantify market movements and conduct detailed technical analysis. However, while the usefulness of most stock screeners may be apparent, not all platforms are the same. Taking the time to compare your options and find a screener that is compatible with your trading constraints will help you achieve your long-term trading objectives.
How FinViz Works—Where Does the Data Come From?
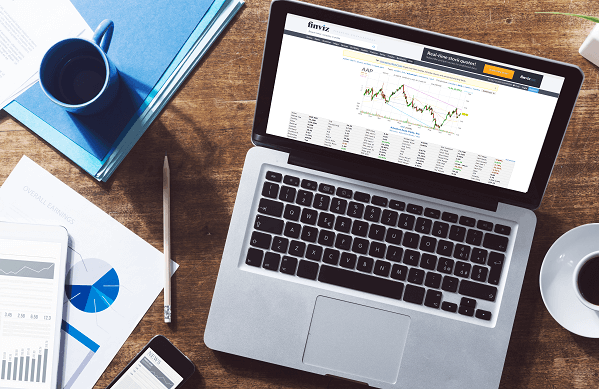
When you first open FinViz, you’ll see a homepage containing various charts, lists of stocks, and lists of technical indicators. The data comes from recent market quotes, meaning you are looking at the prices of each stock’s most recently executed trades. If you wanted to read about (NASDAQ:TSLA), for example, you could search the stock and begin conducting an analysis. However, be aware that these quotes are delayed 15 minutes for NASDAQ and 20 minutes for the NYSE and AMEX. While the delay does not affect most long-term investors, it can affect scalpers, day traders, and other short-term market speculators. Signing up for FinViz’s premium package can help reduce delay times.
FinViz (which stands for “Financial Visualizations”) automatically sorts many of its stocks into lists based on specific criteria. For example, the “Top Gainers” list contains the stocks that have experienced the greatest price percentage increases over the past day. The “Overbought” stocks list contains stocks whose technical indicators suggest many investors are on the verge of selling. Other useful categories include “Unusual Volume”, “Insider Buying”, “New High”, “Upgrades”, and more. As you begin experimenting with the platform and developing a long-term trading strategy, keep track of which categories you find to be the most useful.
Having the ability to look at stock prices, indicators, and trends in a single location makes it easier for traders to make important decisions on the fly. However, to further investigate a specific stock, traders will need to switch over to the “Screener” tab. This is where FinViz is able to offer its users the greatest amount of value—especially if you are willing to pay. The tool makes it possible to compare and examine stocks individually (with approximately 8,000 stocks being listed), allowing traders to speculate what a stock might be worth in the future. While each entry contains the ticker, company name, sector, industry, and country information for each stock, this is really just the beginning of what a prospective user can uncover.
How to Use the FinViz Stock Screener
With nearly 8,000 stocks available to select and compare, the FinViz stock screener can be rather overwhelming for inexperienced investors. However, with just a little bit of practice and familiarization, using the screener is something that becomes much more manageable over time. The “Filter” function towards the top of the screen will allow you to take the massive list of stocks and break it down into something that is a bit more manageable. This filter function is what enables FinViz to be used by many different traders. No matter your approach to investing in the stock market, you’ll be able to take the long list of 8,000 stocks and narrow it down to a select few.
There are several filters available—each is capable of helping you build your own list of stocks in a different way. Sorting by stock exchange (NYSE, NASDAQ, etc.), index (S&P 500, Dow, etc.), sectors, and industry, you can narrow your view of the market and begin trading in the spaces where you feel comfortable. It is important to note that FinViz is not a stock trading platform on its own; FinViz is a stock screener that should be utilized alongside a trading platform.
Beyond the qualitative search categories mentioned above, you can also sort by qualitative criteria such as price, market cap, and price to earnings ratios. Both technical and fundamental analysis tools are available directly on the screener page. The “valuation”, “financial”, “ownership”, “performance”, and other tabs make it possible to further narrow your stock evaluations. Some investors may look for specific fundamental news stories, such as the announcement of a stock buyback. Once you are familiar with using the FinViz sorting and monitoring tools, you’ll be able to apply these tools to your specific approach to trading.
How to Invest Using FinViz
FinViz is a stock screener. It’s not a trading platform, like eTrade, TD Ameritrade, or Robinhood. However, FinViz can still be used for making both long-term and short-term investment decisions. When comparing short-term investment options, looking at specific technical indicators will help you make much more objective choices. Using the categories features on the front page—such as overbought, new low, insider buying, and various others—can also help you determine whether a stock is likely to increase in value. Various different chart patterns will help reveal a wealth of useful information.
Long-term investments will require considerably more research. Long-term traders are not particularly interested in what a stock will be worth at the end of the day. Instead, they are interested in knowing what a stock will be worth in one year, ten years, or even longer. Using value stock trading strategies will help you improve. While Warren Buffet’s advice to “only trade what you know” may cause you to be overly cautious, it is not a bad rule of thumb to follow. To conduct long-term research using FinViz, prioritize the news, TA (technical analysis), and the “backtest” tabs. Backtesting is also available for paid members.
How to Use FinViz While Day Trading
Day traders make multiple trades within the same trading period. They focus on opening and closing short-term positions when markets are volatile or reacting to sudden events. FinViz can be used for intraday trading, though you should be cautious when relying on data. While the 15 to 30-minute delay is generally not much of an issue, these precious minutes can make a major difference when markets are moving at an unusual rate. If you do plan on day trading, it may be worth spending $25 per month to have more accurate data.
Due to the time delay, it’s better to use FinViz as a guideline when setting stop-loss orders. You should begin by trading on paper, allowing you to see if your intraday trading strategies are actually effective. Using tools such as dividend stock screeners will make it easier to find stocks that are right for you.
How to Use FinViz While Swing Trading
Contrary to day traders, swing traders will hold their positions for multiple days or even multiple weeks at a time. Swing trading is an intermediate-term trading strategy that works well with FinViz’s tools. Swing traders can use a variety of technical indicators, including moving averages, crossovers, relative strength, and more. They can further benefit by paying attention to the geometric signals on the first page, including wedges, triangles, and head and shoulder patterns. From there, you can look at maps and stock charts, and determine which individual stocks are right for you. Swing traders will also enjoy reading reports as they are released (the reports are even sorted by potential “impact”). Because markets are typically late to respond and tend to overreact to new stories, careful tracking of news stories can create a wealth of swing trading opportunities.
How to use FinViz for Forex
From the home page, users can easily access the “Forex” trading page, which is located near the top of their screen. Once you are on this page, you will discover listings of the most commonly traded forex pairs in the world. FinViz’s color-coding system makes it easy to recognize which direction each pair is trending, though the colors (red and green) can be difficult for color-blind people to distinguish. The pairs—which also include oil, gold, and Bitcoin (BTC)—can be adjusted to display relationships over varying periods of time. The bar chart near the bottom of the page allows traders to quickly recognize each currency’s “One day relative performance (USD).” This chart will make it much easier to explore the forex futures market, too. From there, investors will be able to decide which forex positions are most likely to be profitable.
Other Strategies for Using FinViz
As any successful trader will tell you, the importance of diversification cannot be overstated. You want to succeed without exposing yourself to too much risk. Fortunately for FinViz users, the platform makes it easy to develop a diverse approach to trading that can be easily sustained over time. FinViz’s different stock screening pages make it possible to track different stocks and different asset classes over varying periods of time. Once you are familiar with the platform, you’ll find yourself in a better position to recognize potentially profitable positions. Use FinViz to develop a comprehensive trading or investment strategy that can be enacted on a platform of your choice.
FinViz can be used in a variety of different trading settings. If you have a new trading strategy, indicator, or portfolio philosophy you would like to test out, you can use FinViz for both backtesting and paper trading purposes. While there are several areas where FinViz needs improvement, the platform as a whole is fairly dynamic and comprehensive.
Benefits of Using FinViz
When you first visit FinViz, it’s easy to feel overwhelmed by all the data. The homepage provides you with ample information about the stock market and can help short-term traders make quick decisions on how to buy stock. Once you are familiar with the homepage, it becomes easier to find the sections most useful for your trading strategy. For example, while some traders prefer to look at insider trading actions listed towards the bottom, others are more concerned with buy/sell signals displayed towards the top.
The format of FinViz helps traders get a quick overview of the market (something that is often useful for fast-paced, instinctual traders) or analyze specific stocks, indexes, and sectors. If you are exploring the stock market, FinViz can provide a lot of information. Other markets, particularly forex and crypto, lack the same level of depth—though there is still information that some active traders may find useful.
FinViz is a relatively useful stock screening platform. While there are several drawbacks to this platform, there are still plenty of benefits.
Freemium Payment Structure
FinViz offers most of its information for free, which is important for investors who are truly hoping to improve their bottom line. Many of the signals, technical analysis tools, and lists can all be accessed without even needing to create an account. To be fair, most of the information on FinViz can be found elsewhere on the web for free, though it is certainly nice to have the data organized in a single location. Keep in mind that some of FinViz’s analytic tools are reserved for premium members.
Clear Visualizations
In general, FinViz does a pretty good job helping investors understand markets in a visual way. The platform has a variety of methods for presenting information, including candlestick charts, line graphs, percentage bars, and more. FinViz is most helpful for people who prefer to analyze the market visually, rather than looking at the raw data.
Sortable Categories
Individuals who are conducting a detailed analysis of the market are able to sort and screen stocks in several different ways. Sort by signal, industry, volume, or other criteria to zone in on the market and adjust your positions accordingly. These categories are especially useful for traders who have a very specific strategy, such as day trading volatile tech stocks, for example. Traders with a broader approach to the market can also sort by index or other essential details.
General Depth of Information
While it doesn’t do everything, FinViz’s greatest strength is being able to provide base-level information for a wide variety of different traders. Beyond stocks, FinViz offers information relating to crypto, forex, futures, and other essential markets. Traders can use the stock screener to explore nearly 8,000 different public companies. Having access to several technical analysis tools makes it possible to quantify and control for risk, as well.
The more you use the FinViz screener, the more dynamic your trading strategy can become. FinViz can be used for stock picking, evaluating exchange-traded funds, ranking mutual funds, analyzing hedge funds, and evaluating the stock market as a whole. FinViz futures features will allow you to expand your trading strategy and explore the often-lucrative futures market.
Ultimately, the true benefits you gain from using FinViz will depend on your personal trading objectives. For some investors, this freemium platform is enough for them to be confident in their decisions. After looking at different stock analyst ratings, traders may be confident enough to use this information and then make decisions on their own. At the same time, others prefer to use a more in-depth platform, even if that platform carries additional costs.
Drawbacks of Using FinViz
While there are some benefits of using the FinViz stock screener, it is still important to account for the platform’s drawbacks as well. FinViz is far from perfect. Depending on how you hope to use the platform, ignoring these drawbacks can have major consequences.
The most obvious drawback of using the FinViz screener and FinViz futures features is that many of the most useful tools are not free. FinViz charges users a monthly premium ($24.96 per month). For traders with limited portfolios, paying $25 per month can significantly skew the projected risk-reward ratio. If you do decide to use the premium platform, you will need to adjust your targeted break-even point. Premium features include real-time data, email alerts, fundamental charts, and broader forms of analysis (more screener rows per page, layout customization, and backtesting). Even with the premium package, FinViz’s dividend stock screener is still weaker than some alternatives. Without being able to fully evaluate a stock’s dividend yield, you may find yourself opening undesirable positions.
Beyond the potential cost of around $300 per year, the fact that FinViz is not a full-service trading platform causes inconveniences for some traders. While these traders can use the information gathered on FinViz to make decisions elsewhere, having to toggle between data and another trading platform can create complications. After all, if serious investors were using paid trading platforms, the advanced data they need can likely be accessed there.
FinViz contains a lot of information related to markets and can be useful for investors. But, all things considered, the platform itself doesn’t offer unique information. Even information regarding insider transactions can still be easily accessed by the general trading public. While professional traders can enjoy email alerts and insider trading metrics, they may prefer to use something that is a little more in-depth. If you’re new to the stock market, you may find the stock screener to be useful. Just keep in mind that almost all of the information located on FinViz can also be found elsewhere on the internet or on other trading platforms.
The platform does do a good job collecting an array of information in a reasonable amount of time, but you are unlikely to gain any special key insights that weren’t already available to the market as a whole. Platforms such as the TradingView stock screener and MarketBeat, for example, can offer traders an alternative perspective. FinViz also lacks some essentials, such as a truly advanced cryptocurrency screener. The platform itself has a heavy emphasis on stock trading, which can help new traders get their feet wet and begin developing basic analysis techniques.
FinViz Review
Navigating the stock market can be easier than most people think. With stock market data, legal insider trading metrics, email alerts, charting software, and FinViz news, you’ll have a dynamic set of tools by your side that can help you begin investing and building a profitable portfolio.
Whether you are trading cryptocurrency, investing in tech stocks, swing trading foreign currencies, or any combination thereof, you will need to have tools that empower you to analyze the entire market. With a substantial selection of visualizations, charts, and methods for screening stocks, FinViz is a platform that has helped many traders improve their skills. Though the platform still has a few shortcomings, it is not without merit. Compare FinViz to other top trading platforms like MarketBeat and see what works best for you.
Before you make your next trade, you'll want to hear this.
MarketBeat keeps track of Wall Street's top-rated and best performing research analysts and the stocks they recommend to their clients on a daily basis.
Our team has identified the five stocks that top analysts are quietly whispering to their clients to buy now before the broader market catches on... and none of the big name stocks were on the list.
They believe these five stocks are the five best companies for investors to buy now...
See The Five Stocks Here
Which stocks are likely to thrive in today's challenging market? Click the link below and we'll send you MarketBeat's list of ten stocks that will drive in any economic environment.
Get This Free Report