Featured Articles and Offers
 View Archer Aviation Gets Analyst Target Upgrade: Time to Load Up?Archer Aviation Gets Analyst Target Upgrade: Time to Load Up?By Jeffrey Neal Johnson | April 25, 2025
- From Porter & Company(Ad)
 View Enbridge Inc. (NYSE:ENB) Announces Dividend Increase - $0.68 Per ShareEnbridge Inc. (NYSE:ENB) Announces Dividend Increase - $0.68 Per ShareBy MarketBeat | April 28, 2025
 View 2 Smart Investments to Follow Warren Buffett’s Lead2 Smart Investments to Follow Warren Buffett’s LeadBy Ryan Hasson | April 23, 2025
 View Nebius Group (NBIS) Expected to Announce Quarterly Earnings on FridayNebius Group (NBIS) Expected to Announce Quarterly Earnings on FridayBy MarketBeat | April 26, 2025
- From Porter & Company(Ad)
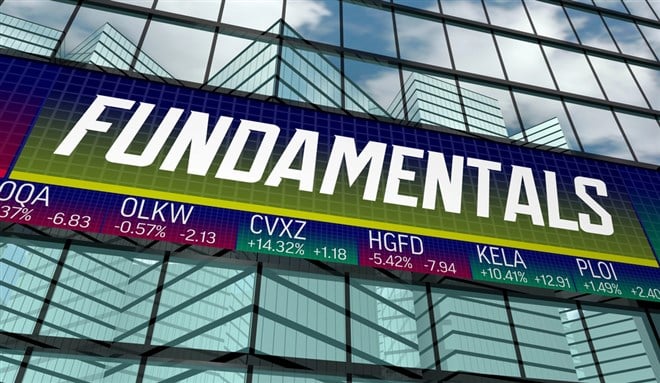 View Fundamentally Sound, These 5 Stocks Sold Off AnywayFundamentally Sound, These 5 Stocks Sold Off AnywayBy Thomas Hughes | April 23, 2025
 View Ken Gilmartin Purchases 30,300 Shares of John Wood Group PLC (LON:WG) StockKen Gilmartin Purchases 30,300 Shares of John Wood Group PLC (LON:WG) StockBy MarketBeat | April 27, 2025

Recent Videos


Stock Lists
All Stock Lists- 5G
- Biotech
- Blue Chip
- FAANG
- Gold
- Large Cap
- Marijuana
- Micro Cap
- Oil
- REITs
- Russell 2000
- Small Cap
- Warren Buffett
Investing Tools
Calendars and Tools- Analyst Ratings
- Cryptocurrency Screener
- Congressional Trading
- Dividend Increases
- Dividend Calculator
- Dividend Calendar
- Earnings Announcements
- Insider Trades
- Options Profit Calculator
- Penny Stocks
- Portfolio Monitoring
- Short Interest
- Stock Comparisons
- Stock Market Holidays
- Stock Screener
Search Headlines
Get 30 Days of MarketBeat All Access for Free
Sign up for MarketBeat All Access to gain access to MarketBeat's full suite of research tools.
Start Your 30-Day TrialMarketBeat All Access Features
Sign in to your free account to enjoy these benefits
- In-depth profiles and analysis for 20,000 public companies.
- Real-time analyst ratings, insider transactions, earnings data, and more.
- Our daily ratings and market update email newsletter.
Sign in to your free account to enjoy all that MarketBeat has to offer.
or
By creating a free account, you agree to our terms of service. This site is protected by reCAPTCHA and the Google Privacy Policy and Terms of Service apply.