Created by the Chicago Board of Options Exchange in 1993, the VIX (the Volatility Index) is a real-time market index that measures market risk by quantifying market expectations for volatility in the S&P 500 index for the upcoming 30-day period. Because the VIX is often used to indicate market sentiment and investor anxiety – with higher values indicating greater market fear and uncertainty and lower values suggesting a more stable and confident market environment – it is often called the "Fear Index" or the "Fear Gauge."
When the VIX value rises, traders expect a significant price swing in the
S&P 500 index in the next 30 days. When it drops, traders don't expect significant price swings in the next 30 days, often attributed to complacency. There is no VIX stock, and it doesn’t impact
penny stocks much unless they correlate to the S&P 500.
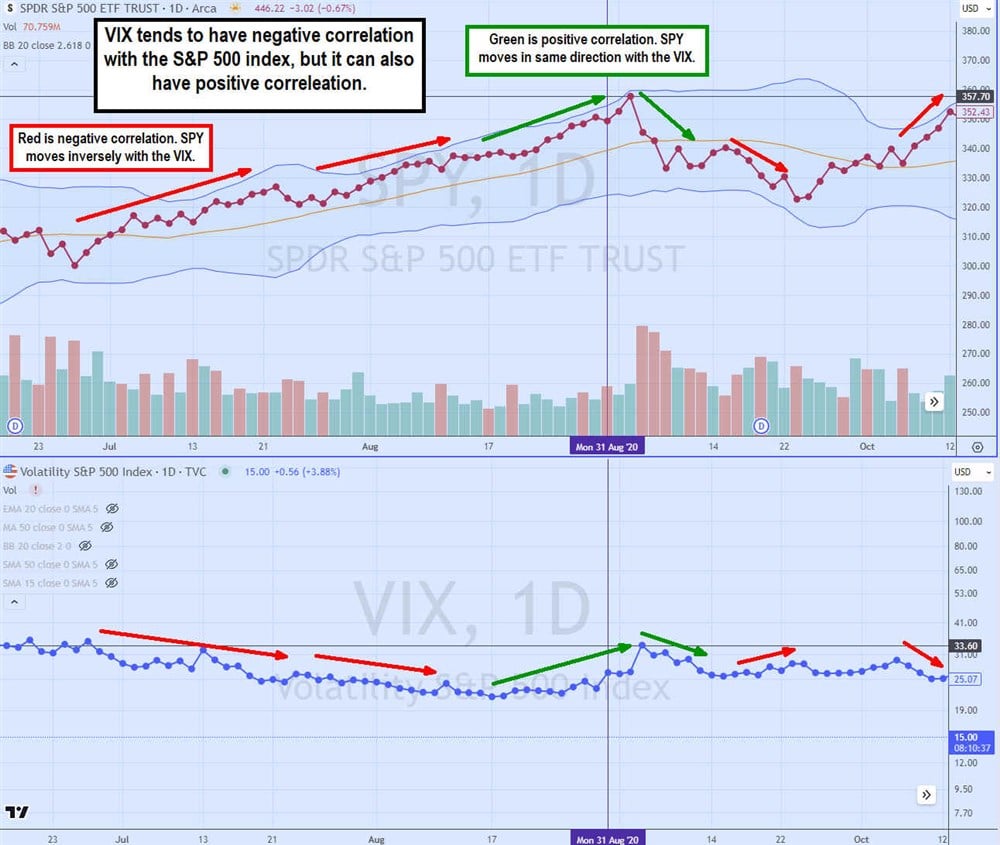
While the VIX is technically a non-directional indicator, it has a historically strong inverse relationship with the S&P 500 index. However, this negative correlation doesn't occur every time. When the VIX moves sharply higher, the S&P 500 index and stocks tend to fall swiftly. This negative correlation represents the inverse relationship indicated with the red arrows in the VIX indicator chart with the S&P 500 index NYSEARCA: SPY and the VIX.
When the VIX collapses, the S&P 500 index tends to rise sharply. However, there are instances where the VIX moves in the same direction as the VIX, called positive correlation, indicated by the green arrows in the above chart. This may not seem logical until you realize a spiking VIX projects a larger price move, just not always the direction. Looking at the SPY chart, you can see the VIX tends to correlate negatively with the S&P 500 most of the time, but not always. A positive correlation can happen during volatile periods driven by major economic news, including interest rate announcements, CPI reports, bellwether earnings reports and conference calls, pandemics or geopolitical and news events.
What is Volatility?
Volatility is the degree of variation of a financial instrument's price over time. It is a statistical measure that reflects the extent of price fluctuations in the market. High volatility means that the price of the asset can change dramatically over a short period in either direction, while low volatility indicates that the price changes are more gradual and stable.
There are two types of volatility:
- Historical Volatility: This measures the past price fluctuations of a security, typically expressed as the standard deviation of the asset's returns over a specific period. It provides a sense of how volatile an asset has been historically.
- Implied Volatility: This measures the market's expectation of future volatility, derived from the prices of options on the asset. Higher implied volatility suggests that investors expect larger price swings in the future.
How to Use the VIX
The VIX is an important investment tool that can help you:
- Gauge Market Sentiment: High VIX levels indicate increased fear and uncertainty, while low VIX levels suggest complacency and confidence. You can use this information to adjust your risk exposure.
- Hedge Your Portfolio: During periods of high volatility, you might use hedging strategies to protect your portfolio. This can include buying options or using inverse ETFs that perform well when the market declines.
- Adjust Portfolio Allocation: You might adjust your asset allocation based on VIX levels. For example, you may shift towards more defensive assets like bonds or cash during periods of high volatility or switch to aggressive growth strategies during periods of low volatility.
- Determine Entry and Exit Points: You might consider entering the market when the VIX is high (indicating fear) and exiting when the VIX is low (indicating complacency).
- Perform Macro Analysis: You can use trends in the VIX to understand broader economic conditions and market expectations.
- Monitor Event Risks: Because the VIX often spikes around major economic or geopolitical events, monitoring it can help you gauge the market's reaction to those events and position your portfolio accordingly.
- Enhance Risk Models: Use VIX data to adjust exposure based on volatility expectations.
- Utilize VIX-related Instruments: Consider trading VIX futures, options, ETFs, or ETNs to directly engage with volatility.
How to Trade the VIX
In addition to using the VIX to help manage risk, identify opportunities, and enhance investment strategies, you can also trade it. Trading the VIX can be profitable but is also inherently risky. It requires careful analysis, strategic planning, disciplined execution and an understanding of options, futures, and related financial instruments.
Risk management is crucial when trading the VIX. Consider using stop-loss orders, managing your position sizes, and engaging in pairs trading (going long on one VIX product while shorting another) based on your view of relative value or expected convergence/divergence. Technical and fundamental analysis will help you identify trends and patterns in VIX movements. Make sure you stay informed about market news that could impact volatility, like Fed announcements and geopolitical events.
The main ways to trade the VIX include:
VIX Futures
You can buy VIX futures if you expect volatility to increase or sell VIX futures if you expect it to decrease. VIX futures can also be used for hedging. Remember that VIX futures have expiration dates and may not perfectly track the spot VIX due to contango and backwardation in the futures curve. Using spread strategies like calendar spreads (buying and selling futures with different expiration dates) can help manage the risk associated with VIX futures.
VIX Options
VIX options can be complex (with pricing influenced by factors such as time decay and implied volatility), but calls and puts on the VIX can allow for strategic positioning based on volatility expectations. You can buy VIX call options if you expect an increase in volatility or put options if you anticipate a decrease. You can also use combinations like straddles or spreads to capitalize on specific volatility movements. By buying VIX futures or calls, you can offset losses in your equity holdings during periods of high volatility.
VIX ETFs and ETNs
Exchange-traded funds (ETFs) and exchange-traded notes (ETNs) that track VIX futures offer a way to gain exposure to the VIX without trading futures directly.
If you expect volatility to rise, you can invest in funds like the ProShares VIX Short-Term Futures ETF BATS: VIXY and the iPath Series B S&P 500 VIX Short-Term Futures ETN BATS: VXX. The VXX is one of the most liquid ETNs and ETFs, with over seven million daily shares traded. Because VIX ETFs and ETNs often suffer from roll yield (which can erode value over time), they are more suitable for short-term trading.
If you expect volatility to decline, you can utilize inverse VIX ETFs and ETNs like the ProShares Short VIX Short-Term Futures ETF BATS: SVXY, which is designed to provide the inverse of the one-day performance of the S&P 500 VIX Short-Term Futures Index. Remember that the VIX is a number reading, not a price or dollar value, and inverse products can be risky – especially when volatility spikes sharply due to sudden market stress.
How to Calculate VIX Values
While using the latest VIX quoted values is much easier and practical, you can attempt to calculate it manually.
The VIX is calculated using a wide range of S&P 500 index options, usually more than 100 puts and calls, with maturities of 23 to 37 days. The selection of the options contracts is proprietary. Although each calculation varies, the VIX is more sensitive to changes in the prices of the lower strike options and less so to the higher strike-priced options.
According to S&P Global, there are four steps to calculating the expected range of the S&P 500 using the VIX:
- Convert the VIX level to an annual percentage.
- Divide the annual percentage by the square root of 12 to get the 30-day implied volatility.
- Multiply the current S&P 500 level by the 30-day implied volatility to estimate the potential impact on the index level.
- Establish the expected range of the S&P 500 level by calculating the lower and upper levels based on the implied volatility.
Examples of Trading the VIX
Let's use the SPY as a trading vehicle to play the VIX signals. While you can't trade the VIX directly, you can trade a VIX ETF and treat it like a stock. However, the more common and widely used trading is playing the inverse relationship to the SPY.
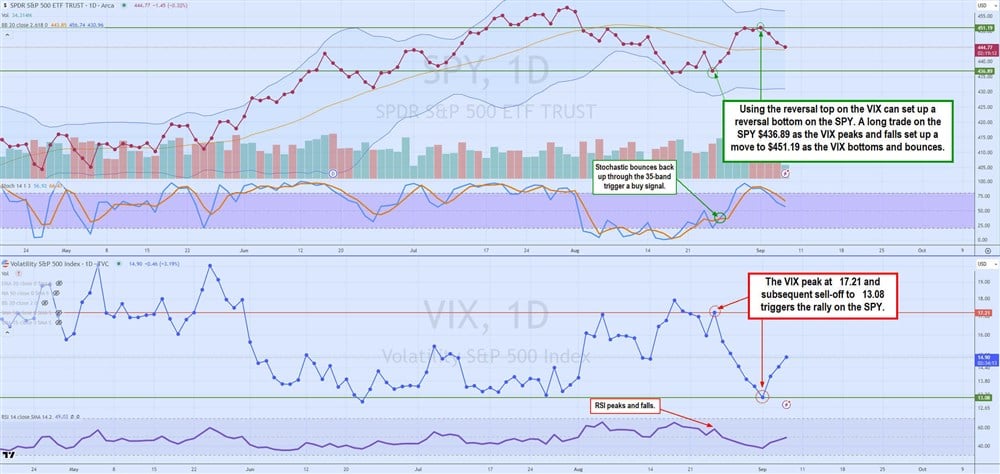
The SPY (top chart) and VIX (lower chart) illustrate the inverse relationship: as the SPY rises, the VIX below falls. The opportunity to trade off the VIX peak occurs on August 24.
The VIX peaks at 17.21, causing the relative strength index (RSI) to reject its bounce attempt at the 60-band and move lower, indicating distribution selling. The SPY chart indicates a bottom and long trigger at $436.89 as the stochastic triggers a buy signal as it crosses back up off the 20-band. This indicates that buying momentum is coming into the stock. Both instruments trigger their respective reversal signal using a momentum indicator.
The SPY eventually rallies to a peak of $451.19 on September 1 before falling as the stochastic oscillator falls under the overbought 80-band. The VIX falls to a low of 13.08 on September 1 before bouncing as the daily RSI bounces back up from the 37-band.
What Are High and Low VIX Values?
Historically, a VIX below 15 is considered a low value and a VIX above 30 is considered a high value. The range between 15 and 30 is considered moderate, with more turbulence as it gets closer to 30.
Remember that the VIX can fall into single digits, which indicates significant market complacency. This typically occurs during strong markets that are steadily rising. Such periods of low volatility are prone to sharp reversals when traders least expect them. Conversely, when the VIX trades above 30, it signifies elevated market fear. During extreme market downturns or bear markets, the VIX has surged to levels around 80, indicating massive market fear and extreme uncertainty, often described as "blood in the streets."
During the 2020 pandemic, the VIX spiked massively from 13.68 on February 14, 2020, to 82.69 on March 16, 2020. The SPY fell from $337.42 to $239.85 during the same four-week period. The magnitude of the panic plunge in the SPY caused the VIX to skyrocket to panic highs simultaneously.
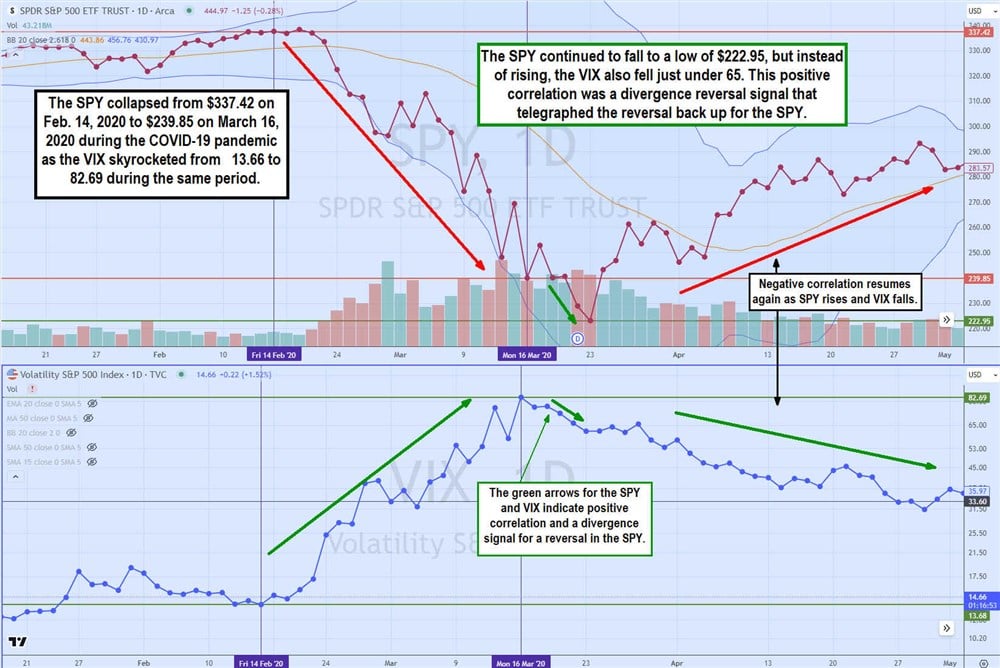
Incidentally, the negative correlation turned positive when the SPY continued to make a new low of $222.95, and the VIX also fell to $ 61.59. This positive correlation was a divergence trigger, often a signal for a potential reversal in the SPY. That happened as the SPY bottomed out, and the VIX fell under 65. This is another way to use the VIX to spot divergence, which often precedes reversals in the SPY.
Should You Trade the VIX?
Trading the VIX can be highly rewarding but comes with significant risks. The VIX's movements are often rapid and influenced by market events, making it a volatile and unpredictable asset. Successful trading requires a deep understanding of volatility, market dynamics, and the specific financial instruments used to trade the VIX, such as futures, options, ETFs, and ETNs. Risk management strategies are crucial to mitigate potential losses, and traders must stay informed about economic indicators, geopolitical events, and market news that can impact volatility. While trading the VIX offers opportunities for profit during periods of market turmoil, it is generally more suitable for experienced traders who can navigate its complexities and inherent risks.
Before you consider ProShares Short VIX Short-Term Futures ETF, you'll want to hear this.
MarketBeat keeps track of Wall Street's top-rated and best performing research analysts and the stocks they recommend to their clients on a daily basis. MarketBeat has identified the five stocks that top analysts are quietly whispering to their clients to buy now before the broader market catches on... and ProShares Short VIX Short-Term Futures ETF wasn't on the list.
While ProShares Short VIX Short-Term Futures ETF currently has a "hold" rating among analysts, top-rated analysts believe these five stocks are better buys.
View The Five Stocks Here
With average gains of 150% since the start of 2023, now is the time to give these stocks a look and pump up your 2024 portfolio.
Get This Free Report
Like this article? Share it with a colleague.
Link copied to clipboard.