SG Americas Securities LLC lowered its position in Chart Industries, Inc. (NYSE:GTLS - Free Report) by 42.7% during the fourth quarter, according to its most recent filing with the SEC. The firm owned 15,448 shares of the industrial products company's stock after selling 11,506 shares during the period. SG Americas Securities LLC's holdings in Chart Industries were worth $2,948,000 as of its most recent filing with the SEC.
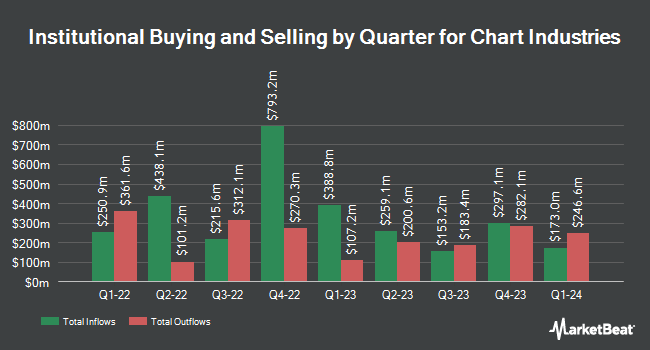
A number of other institutional investors have also bought and sold shares of the company. National Bank of Canada FI raised its holdings in shares of Chart Industries by 328.7% in the third quarter. National Bank of Canada FI now owns 6,757 shares of the industrial products company's stock valued at $839,000 after purchasing an additional 5,181 shares during the last quarter. B. Riley Wealth Advisors Inc. raised its stake in Chart Industries by 248.0% in the 3rd quarter. B. Riley Wealth Advisors Inc. now owns 22,257 shares of the industrial products company's stock valued at $2,744,000 after acquiring an additional 15,862 shares during the period. Fisher Asset Management LLC lifted its stake in shares of Chart Industries by 2.3% during the 3rd quarter. Fisher Asset Management LLC now owns 592,486 shares of the industrial products company's stock valued at $73,551,000 after buying an additional 13,181 shares in the last quarter. Mitsubishi UFJ Asset Management UK Ltd. grew its position in shares of Chart Industries by 26.7% in the fourth quarter. Mitsubishi UFJ Asset Management UK Ltd. now owns 9,500 shares of the industrial products company's stock valued at $1,813,000 after purchasing an additional 2,000 shares in the last quarter. Finally, Blueshift Asset Management LLC bought a new stake in shares of Chart Industries during the third quarter valued at about $373,000.
Chart Industries Stock Performance
GTLS stock traded up $2.40 on Friday, hitting $218.41. The company had a trading volume of 397,975 shares, compared to its average volume of 538,000. The company has a current ratio of 1.27, a quick ratio of 1.00 and a debt-to-equity ratio of 1.16. Chart Industries, Inc. has a 12-month low of $101.60 and a 12-month high of $220.03. The stock has a market cap of $9.35 billion, a price-to-earnings ratio of 63.31, a P/E/G ratio of 0.64 and a beta of 1.84. The stock's 50-day simple moving average is $195.45 and its 200 day simple moving average is $154.45.
Chart Industries (NYSE:GTLS - Get Free Report) last released its quarterly earnings results on Friday, November 1st. The industrial products company reported $2.18 EPS for the quarter, missing the consensus estimate of $2.56 by ($0.38). The business had revenue of $1.06 billion for the quarter, compared to analysts' expectations of $1.10 billion. Chart Industries had a net margin of 4.30% and a return on equity of 13.25%. Chart Industries's revenue for the quarter was up 18.3% compared to the same quarter last year. During the same period in the previous year, the company earned $1.28 EPS. As a group, equities research analysts expect that Chart Industries, Inc. will post 9.02 earnings per share for the current fiscal year.
Wall Street Analysts Forecast Growth
A number of equities research analysts recently issued reports on GTLS shares. Wells Fargo & Company lowered their price objective on Chart Industries from $151.00 to $146.00 and set an "overweight" rating on the stock in a research report on Thursday, October 3rd. Stifel Nicolaus upped their target price on Chart Industries from $200.00 to $231.00 and gave the stock a "buy" rating in a research note on Tuesday, December 31st. Bank of America lowered their target price on Chart Industries from $185.00 to $165.00 and set a "buy" rating for the company in a research note on Monday, October 14th. Craig Hallum raised their target price on shares of Chart Industries from $199.00 to $207.00 and gave the stock a "buy" rating in a report on Monday, November 4th. Finally, Barclays lowered their price objective on shares of Chart Industries from $146.00 to $145.00 and set an "equal weight" rating for the company in a research note on Monday, November 4th. Three equities research analysts have rated the stock with a hold rating, eight have issued a buy rating and two have given a strong buy rating to the stock. Based on data from MarketBeat.com, the company currently has an average rating of "Moderate Buy" and a consensus target price of $188.75.
Get Our Latest Research Report on Chart Industries
Chart Industries Profile
(
Free Report)
Chart Industries, Inc engages in the designing, engineering, and manufacturing of process technologies and equipment for the gas and liquid molecules in the United States and internationally. The company operates in four segments: Cryo Tank Solutions, Heat Transfer Systems, Specialty Products, and Repair, Service & Leasing.
Further Reading
Before you consider Chart Industries, you'll want to hear this.
MarketBeat keeps track of Wall Street's top-rated and best performing research analysts and the stocks they recommend to their clients on a daily basis. MarketBeat has identified the five stocks that top analysts are quietly whispering to their clients to buy now before the broader market catches on... and Chart Industries wasn't on the list.
While Chart Industries currently has a "Moderate Buy" rating among analysts, top-rated analysts believe these five stocks are better buys.
View The Five Stocks Here
MarketBeat has just released its list of 20 stocks that Wall Street analysts hate. These companies may appear to have good fundamentals, but top analysts smell something seriously rotten. Are any of these companies lurking around your portfolio?
Get This Free Report
Like this article? Share it with a colleague.
Link copied to clipboard.