The
S&P 500 NYSEARCA: SPY has hit two of three upside targets outlined a few weeks ago in MarketBeat original article
“S&P 500 in ‘Fake it Til You Make It’ Melt-up Trajectories”. The market has shunned off any skepticism as optimism for a COVID-19 vaccine and dovish Federal Reserve (Fed) drives markets to new all-time highs. Breadth is starting to catchup as 50% of the S&P 500 index component stocks are still negative on the year. As we head into a seasonally bearish calendar period from September to October, the question is whether the melt-up bubble will pop or accelerate higher driven by FOMO? Time will reveal the answer, but key price inflection levels are quickly approaching which point to
$353.73 to $354.44 range as a potential near-term top or a launching pad for a
parabolic spike towards $362.26.
Nasdaq 100 Sprint
The Nasdaq 100 index NASDAQ: QQQ has been the lead benchmark index ever since it surpassed its pre-COVID-19 February all-time highs of $237.47 on June 5th, 2020. The QQQ continues to make new all-time highs accelerated by the momentum from the upcoming 4-for-1 stock split in Apple NASDAQ: AAPL shares and 5-for-1 stock split in Tesla NASDAQ: TSLA shares effective Aug. 31, 2020. Unlike the Dow Jones Industrial Average, the Nasdaq 100 is a market-cap-weighted index (not price-weighted) with no financial stocks. The impact of AAPL and TSLA stock splits will only impact the QQQs if the market cap falls rapidly on profit-taking. Incidentally, the QQQ is trading above its monthly upper Bollinger Bands (BBs) at $289.08, so a reversion is in the cards once it falls back under the upper BBs.
Disconnect with Reality?
As pointed out many times before, the markets tend to move based on which narrative it chooses to embrace, which impacts sentiment which moves price. However, when price accelerates to extreme levels in either direction, it has the power to control the narrative and sentiment. In other words, collapsing stock prices controlled the narrative and sentiment during the February to March pandemic plunge. Rising stock prices are once again controlling the narrative and sentiment to justify the melt-up.
Sell-the-News or Spread the Breadth
The SPY is composed of most of the pandemic losers and epicenter industries including financials, travel, leisure, dining, and consumer discretionary. As money flows out of the QQQ, will it spread into the SPY and its laggard sectors? Even within the SPY, there are deeper laggards that may get money flow even as leaders peak out. We are seeing (possibly premature) rallies in laggard industries as the market assumes that no matter how ugly 1H 2020 results were, the worst is behind them (barring bankruptcy). Companies that reported year-over-year (YoY) revenues exceeding (-50%) drops are seeing an acceleration in share prices as money is looking for bargains. Is the SPY putting the cart in front of the horse in anticipation of laggards recovering on a COVID-19 vaccine approval? If so, then a sell-the-news reaction is a likely, but breadth may improve as money flows into the deep laggards. Either way, here are the price trajectories to monitor moving forward.
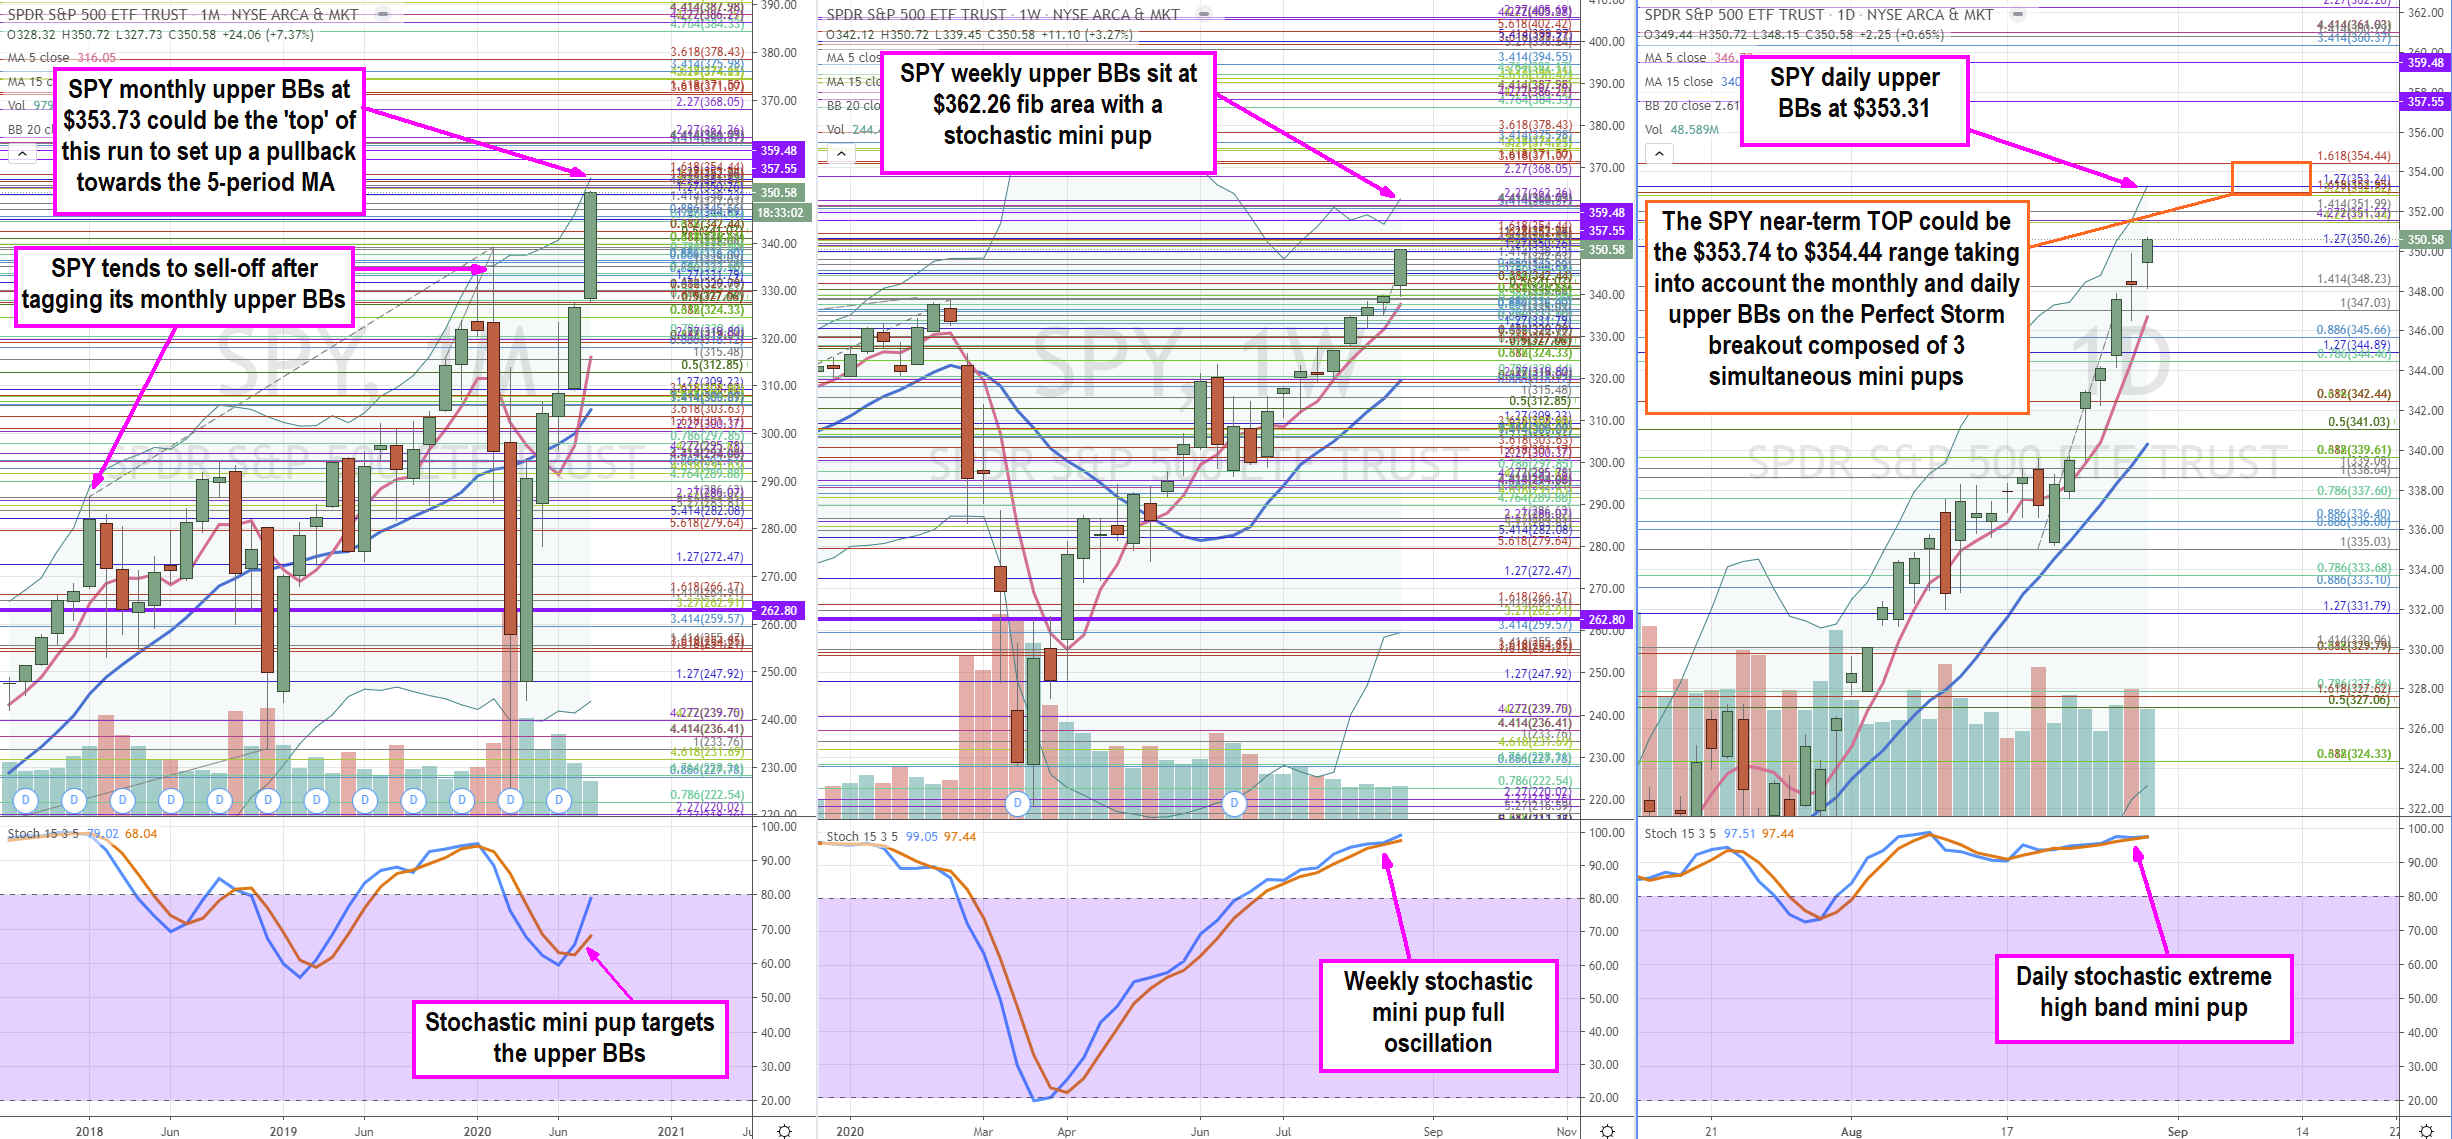
SPY Price Trajectories
Using the rifle charts on monthly, weekly and daily time frames, we lay out the full near-term to longer-term playing field traders and investors. There is a perfect storm breakout in progress with all three wider time frames in simultaneous stochastic mini pups. Using a 2.618 standard deviation on the upper BB envelopes, the upside projections are at $353.73, $362.26 and $353.31 on the monthly, weekly, and daily rifle charts. The most significant chart is the powerful monthly time frame and it has always pulled back after touching the upper BBs As a caveat, it is possible to exceed the upper BBs and go parabolic (as the QQQs are currently doing), but prices always revert back down through the monthly upper BBs usually peaking out the daily time frame for a reversion back towards the monthly 5-period MA currently at $305. The last time the SPY exceeded its monthly BBs was February 2020 just ahead of the pandemic plunge. The weekly upper BBs have a higher target at $362.26, which is possible after a reversion and bounce off its 5-period MA currently at $337.60. If that level breaks and causes the daily stochastic to cross down, then further pullbacks can be expected towards the weekly 15-period MA at $319.89 and ultimately monthly 15-period MA. As November approaches, focus will shift to the Presidential elections and balance of power in Congress which historically have injected volatility into the markets.
Before you consider SPDR S&P 500 ETF Trust, you'll want to hear this.
MarketBeat keeps track of Wall Street's top-rated and best performing research analysts and the stocks they recommend to their clients on a daily basis. MarketBeat has identified the five stocks that top analysts are quietly whispering to their clients to buy now before the broader market catches on... and SPDR S&P 500 ETF Trust wasn't on the list.
While SPDR S&P 500 ETF Trust currently has a Hold rating among analysts, top-rated analysts believe these five stocks are better buys.
View The Five Stocks Here
With the proliferation of data centers and electric vehicles, the electric grid will only get more strained. Download this report to learn how energy stocks can play a role in your portfolio as the global demand for energy continues to grow.
Get This Free Report
Like this article? Share it with a colleague.
Link copied to clipboard.