Discount broker
Charles Schwab NYSE: SCHW stock took a dramatic collapse on its fiscal Q1 2022 earnings report. The retail brokerage that acquired TD Ameritrade in 2020, missed both top and bottom line analyst estimates in its fiscal Q1 2022 earnings. Schwab faced a number of direct and indirect
headwinds including ongoing effects from the COVID pandemic,
rising inflation,
rate hikes, and the
Russian invasion of Ukraine. Despite the obstacles, Schwab was still able to grow organically by 6% YoY with $121 billion in core new assets and $1.2 million net brokerage accounts averaging 6.5 million trades daily. Schwab ended the quarter with 33.6 million active brokerage accounts and $7.86 trillion in client assets. Market
volatility has resulted in heavy trading activity. With its growing portfolio of services and research solutions for self-directed investors, the Company should continue to weather the macro market sell-off as they benefit from both increases in net interest revenue and asset management fees from the seven interest rate hikes telegraphed for the year by the U.S. Federal Reserve. Prudent investors seeking a stable play that benefits from rising interest rates and market
volatility can watch for opportunistic pullbacks in shares of Schwab.
Q1 Fiscal 2022 Earnings Release
On April 18, 2022, Schwab released fiscal Q1 2022 results for the quarter ending in March 2022. The Company reported an earnings per share (EPS) profit of $0.77 versus $0.84 consensus analyst estimates, missing by (-$0.07). Revenues fell (-0.9%) year-over-year (YoY) to $4.67 billion, missing analyst estimates for $4.82 billion.
CEO Commentary
Schwab CEO Walt Bettinger commented business momentum remained “quite strong” in its fiscal Q1 2022 despite a number of headwinds including ongoing COVID effects, rising inflation, and geopolitical conflict in the Ukraine. Furthermore, the U.S. Federal Reserve initiated a monetary tightening by raising interest rates and signaling approximately seven rate hikes for the year resulting in more volatility and uncertainty in the markets. The benchmark U.S. indices dived more than double digits in the quarter. Trading volume was at the highest level since the reopening averaging more than 6.5 million trades a day. The Company’s full-service model helped to gain 1.2 million new brokerage account and $121 billion in core new assets in the quarter equating to a 6% YoY growth. At the end of the first quarter, Schwab grew total active brokerage client accounts by 5% YoY to 33.6 million and grew total client assets by 11% to $7.86 trillion. CEO Bettinger also highlighted two key personal investing enhancements. A proprietary direct indexing solution that’s designed for tax efficient personal portfolio management with competitive minimums and fee schedule was launched under the title of Schwab Personalized Indexing (SPI). It implements a tax-loss harvesting strategy managed by Schwab investment professionals as it monitors portfolios on a daily basis.
Secondly, Schwab launched its initial thematic stock lists which are created algorithmically to empower self-directed investors seeking to find stocks that meet their investing preferences. The list contains over 900 companies throughout 45 different categories encompassing themes from ESG to data advancements and medical breakthroughs. He concluded, ““We see SPI and our thematic lists as initial steps in giving clients more power in personalizing their investments to reflect their unique circumstances and perspectives. Similarly, simplifying the research experience for clients when selecting mutual funds gives them more power to build their financial futures with investments that make sense for them. We remain committed to pushing forward with these and other strategic initiatives even as we keep our TD Ameritrade integration work on schedule, because we know that both fronts are essential elements of our 'Through Clients’ Eyes' strategy. Schwab’s strong growth reflects the enduring appeal of that strategy for millions of investors as well as the independent advisors who serve them.”

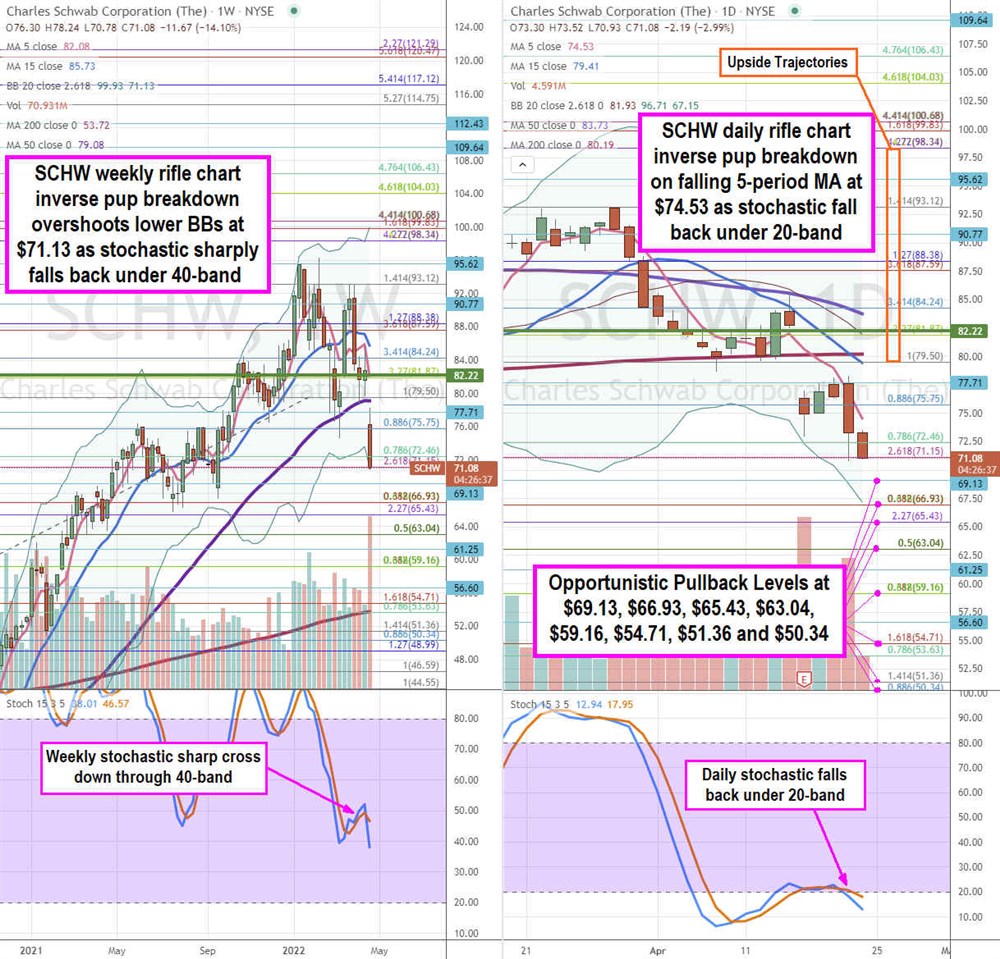
SCHW Opportunistic Pullback Levels
Using the rifle charts on weekly and daily time frames provides a precision view of the landscape for HOOD stock. The weekly rifle chart peaked at the $96.20 Fibonacci (fib) level. The weekly rifle chart formed a channel tightening from the 5-period moving average (MA) at $88.95 to the 15-period MA at $85.66 as the weekly stochastic formed a mini inverse pup that fell under the 80-band. The weekly 50-period MA sits at 76.31. The weekly upper Bollinger Bands (BBs) sit at $71.65. The weekly market structure low (MSL) buy triggers on a breakout through $89.69. The daily rifle chart breakdown formed with a falling 5-period MA at $87.67 and 15-period MA at $90.12 as it also fell under the daily 50-period MA at $88.14. The daily lower BBs sit at $83.48 as the daily stochastic works a full oscillation down towards the 20-band. The daily lower BBs sit at $83.48. Prudent investors can look for opportunistic pullback levels at the $83.45 fib, $80.81 fib, $79.44 fib, $77.68 fib, $75.82 fib, $73.73 fib, $71.62 fib, and the $68.95 fib level.
Before you consider Charles Schwab, you'll want to hear this.
MarketBeat keeps track of Wall Street's top-rated and best performing research analysts and the stocks they recommend to their clients on a daily basis. MarketBeat has identified the five stocks that top analysts are quietly whispering to their clients to buy now before the broader market catches on... and Charles Schwab wasn't on the list.
While Charles Schwab currently has a Moderate Buy rating among analysts, top-rated analysts believe these five stocks are better buys.
View The Five Stocks Here
Market downturns give many investors pause, and for good reason. Wondering how to offset this risk? Enter your email address to learn more about using beta to protect your portfolio.
Get This Free Report
Like this article? Share it with a colleague.
Link copied to clipboard.