WSM
Williams-Sonoma
$135.86 +1.62 (+1.21%) (As of 05:13 PM ET)
- 52-Week Range
- $69.68
▼
$174.26 - Dividend Yield
- 1.68%
- P/E Ratio
- 16.68
- Price Target
- $140.50
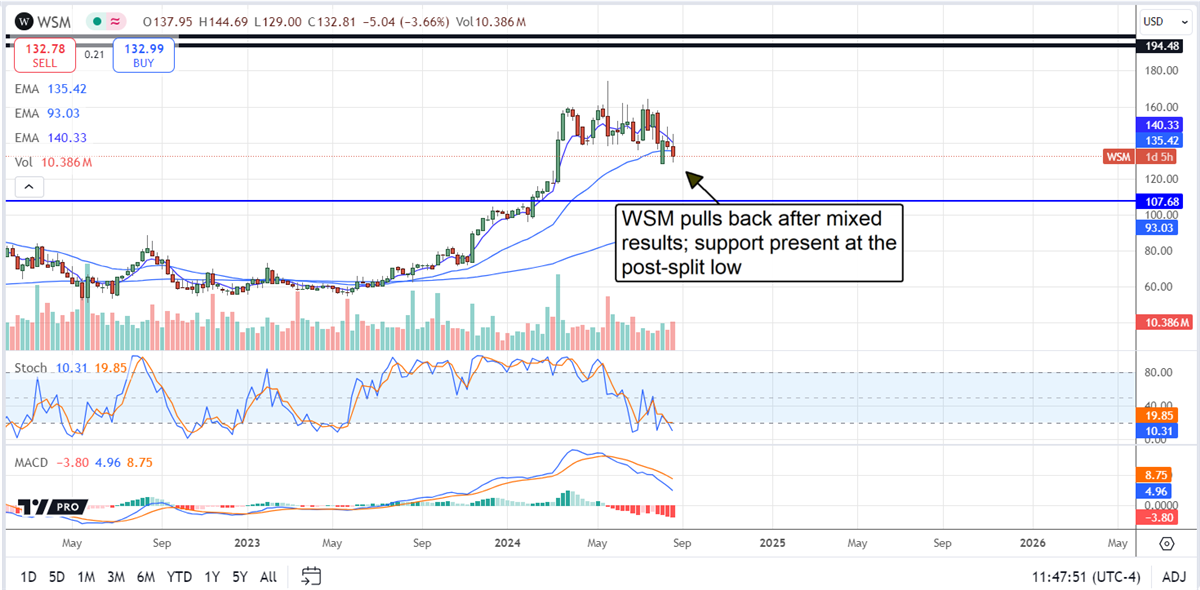
Williams-Sonoma’s NYSE: WSM stock price slumped after its Q2 earnings release, but investors should use this opportunity to load up on a high-quality retail stock. The critical details from the report align with an outlook for steadily rising share prices, and there is a recent stock split to consider. The company completed a two-for-one split in July, cutting its share price in half and increasing accessibility to smaller investors. A stock split does nothing for a company’s fundamental quality, but fundamentally sound businesses that grow tend to split their shares. Historically, companies that split their stock tend to double the S&P 500 NYSEARCA: SPY performance over time.
Williams-Sonoma Falls on Mixed Results: Earnings Quality is the Critical Detail
Williams-Sonoma struggled in Q2, producing $1.79 billion in revenue, down nearly 4% compared to last year and missing the analyst consensus. That aside, the remainder of the details are favorable, including the margin of error. Williams-Sonoma missed the consensus by a slim 110 basis point margin, and profitability gains offset the weakness. Segmentally, three of the four operating segments are down compared to last year, but the contraction is slowing. The core Williams-Sonoma brand is down only -0.8% and Pottery Barn Kids produced growth.
The margin news is what counts. Williams-Sonoma’s brand strength and operational improvements allowed full-priced selling while reducing supply chain costs. The net result is a 550 basis point improvement in gross margin and a 160 basis point improvement in operating margin, which left the operating margin at the high end of the long-term target range, just shy of 17%. The takeaway is that adjusted earnings grew by 11.5% despite the top-line contraction and outpaced consensus by 800 bps, and margin strength is expected to persist.
The guidance is mixed, which is part of why the share price slumped following the report. The company lowered its revenue guidance, which is not good news, but it offset the reduction with an improved outlook for earnings. The company expects the operating margin to run above 18%, up 40 bps at the low and high-end range, sufficient to sustain significant cash flow and balance sheet strength.
Williams-Sonoma Builds Value for Investors with Capital Returns
- Dividend Yield
- 1.68%
- Annual Dividend
- $2.28
- Dividend Increase Track Record
- 19 Years
- Annualized 3-Year Dividend Growth
- 20.88%
- Dividend Payout Ratio
- 28.01%
- Next Dividend Payment
- Nov. 22
WSM Dividend HistoryWilliams-Sonoma’s operational quality drives robust cash flow. Cash flow approached $250 million for the quarter, about 14%, of which 82% or just over $203 million was returned to shareholders. Capital returns include dividends and share buybacks, which reduce the count over time. The dividend is worth about 1.6%, with shares trading near firm support, and is expected to grow over time. The dividend payout ratio is less than 30% of earnings, leaving ample for increases. The company has increased for 19 years and is on track to continue annual increases indefinitely.
The balance sheet is a primary driver for WSM share prices. The cash flow positive quarter led to a substantial increase in cash, current, and total assets while paying dividends and buying back shares. Cash is up more than 100% compared to last year, with debt and total liabilities flat, driving a 40% increase in equity. Because the equity increase is primarily cash, investors may expect a larger-than-average dividend increase this year or accelerated repurchases.
Analysts Lead Williams-Sonoma to All-Time High
The initial analysts' response to Williams-Sonoma’s Q2 results is favorable. The single update tracked by MarketBeat is a reiterated Hold and $170 price target that aligns with the trends. The trends have this stock pegged firmly at a consensus of Hold by 17 analysts with a price target of $138. The $138 is only a few percentage points above the current price action, but most recent targets are well above it, pointing to a range of $150 to $180 or 12% to 35% within the next two to four quarters.
Before you consider Williams-Sonoma, you'll want to hear this.
MarketBeat keeps track of Wall Street's top-rated and best performing research analysts and the stocks they recommend to their clients on a daily basis. MarketBeat has identified the five stocks that top analysts are quietly whispering to their clients to buy now before the broader market catches on... and Williams-Sonoma wasn't on the list.
While Williams-Sonoma currently has a "Hold" rating among analysts, top-rated analysts believe these five stocks are better buys.
View The Five Stocks Here
Which stocks are major institutional investors including hedge funds and endowments buying in today's market? Click the link below and we'll send you MarketBeat's list of thirteen stocks that institutional investors are buying up as quickly as they can.
Get This Free Report
Like this article? Share it with a colleague.
Link copied to clipboard.