The S&P 500 NYSEARCA: SPY index can keep rising this year even if many stocks within it don’t. The reasons are simple and center around the top six holdings. The S&P 500 is a market cap-weighted index, meaning those companies with the highest market cap have the most impact, and when they rise quickly, the index follows suit.
The top five names are Microsoft NASDAQ: MSFT, NVIDIA NASDAQ: NVDA, Apple NASDAQ: AAPL, Amazon NASDAQ: AMZN, Meta Platforms NASDAQ: META, and Alphabet NASDAQ: GOOGL - the six horsemen of the AI apocalypse representing 31% of the total. These stocks are being led higher by results and analysts; this is a look at how high they can go before topping out. Regarding the S&P 500, the technical picture suggests the index could gain another 12% or more by the end of the year, a target that aligns with the outlook for all of these stocks.
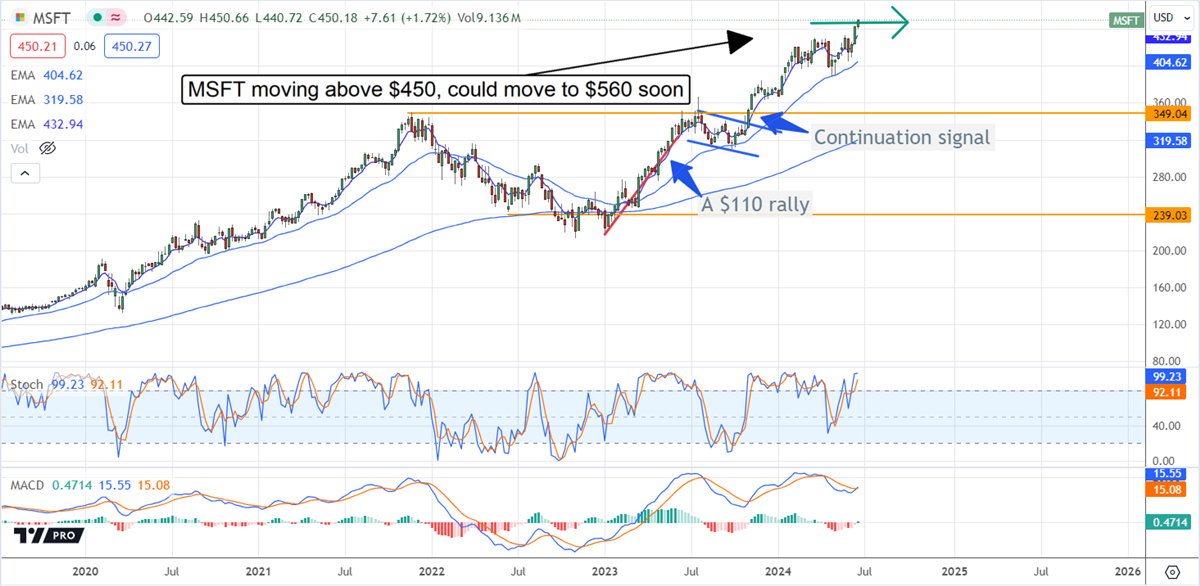
Microsoft Is #1 This Quarter
Microsoft Today
$382.14 -0.05 (-0.01%) As of 04/2/2025 04:00 PM Eastern
- 52-Week Range
- $367.24
▼
$468.35 - Dividend Yield
- 0.87%
- P/E Ratio
- 30.77
- Price Target
- $508.86
The top three stocks by market cap have values ranging so closely together that #1 seems to change daily. However, Microsoft was at the top at the start of the quarter and ranked in 1st position by S&P Global in this quarter’s fact sheet. It is being led higher by the analyst and could rise another $110 or about 25% above the current price action. Analysts' activity has been solid this year, including numerous revisions following the FQ3 earnings report; all were positive and led the market to the high-end range, suggesting a move to $600. The sentiment is driven by demand for Microsoft’s Azure cloud and AI products, compounded by the growing number of deals with top tech players like Oracle and Alphabet.
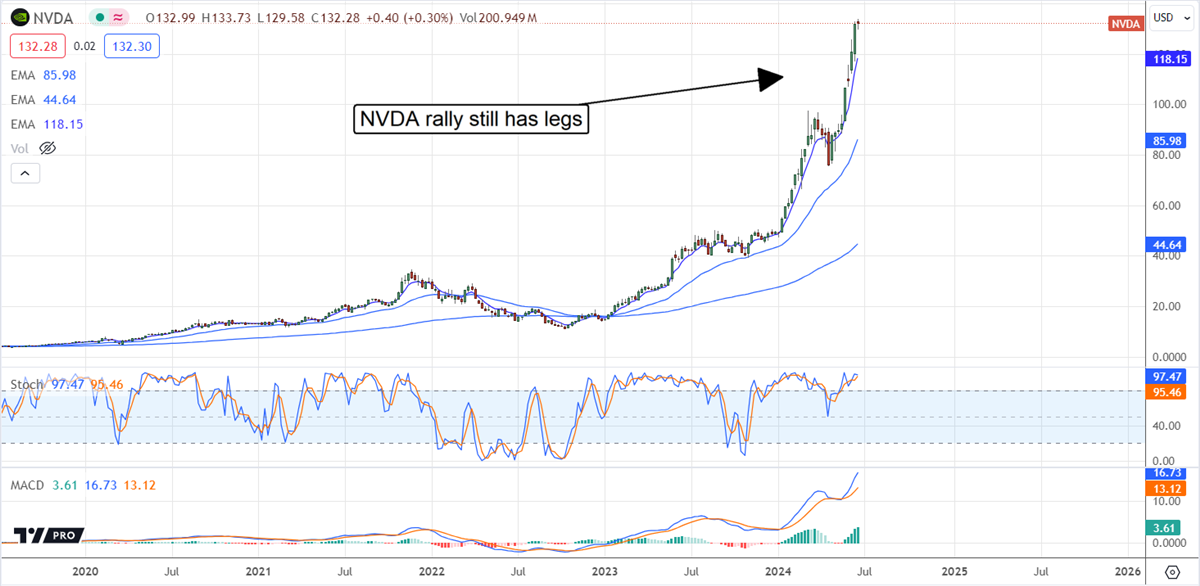
NVIDIA Is a $3 Trillion Company
NVIDIA Today
$110.42 +0.27 (+0.25%) As of 04/2/2025 04:00 PM Eastern
- 52-Week Range
- $75.61
▼
$195.95 - Dividend Yield
- 0.04%
- P/E Ratio
- 43.46
- Price Target
- $171.51
It used to be a big deal when a business hit $1 trillion, but now that milestone has fallen to the wayside. Leading companies like NVIDIA are valued at over $3 trillion and growing due to the game-changing impact of AI. NVIDIA didn’t create AI, but its technology allows it to advance, and it is advancing quickly. NVIDIA did lean hard into a full-stack approach right from the start, adding to its first-move advantage.
The analysts' consensus estimate suggests this stock will fall, but there are mitigating details, including this figure lags trend, and the recent updates are much better. The revision trend has NVIDIA trading closer to $150 on a split-adjusted basis, about 7% higher, and the high estimate will likely advance as the year progresses. NVIDIA is the primary benefactor of the AI bubble, and it has yet to pop. The latest results included 500 basis points of outperformance and equal strength in the guidance, a trend likely to continue this quarter.
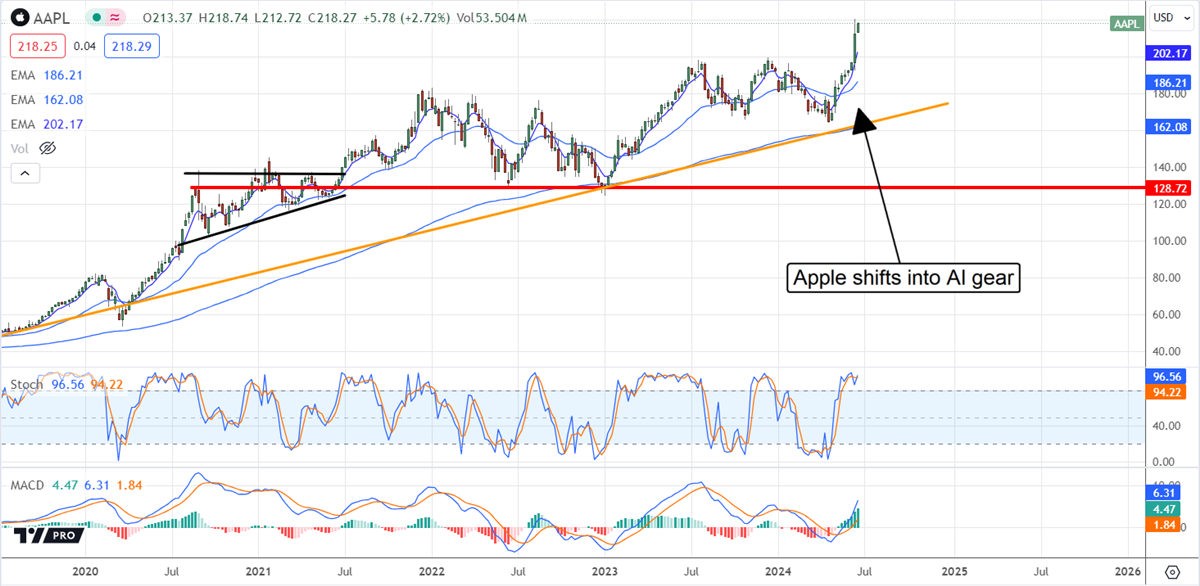
Apple Is Late to AI But Well-Positioned
Apple Today
$223.89 +0.70 (+0.31%) As of 04/2/2025 04:00 PM Eastern
- 52-Week Range
- $164.08
▼
$260.10 - Dividend Yield
- 0.45%
- P/E Ratio
- 35.54
- Price Target
- $245.52
Apple stock struggled with traction in 2022 and 2023, but those days are behind. The recent developers' conference highlighted the company’s new focus on AI features, including embedding ChatGPT into its Mac operating system. The news led to numerous reiterated ratings and price targets and one upgrade to Buy with price points leading the market to a new high. The consensus lags that market, but the high-end range suggests a 13% to 26% upside.
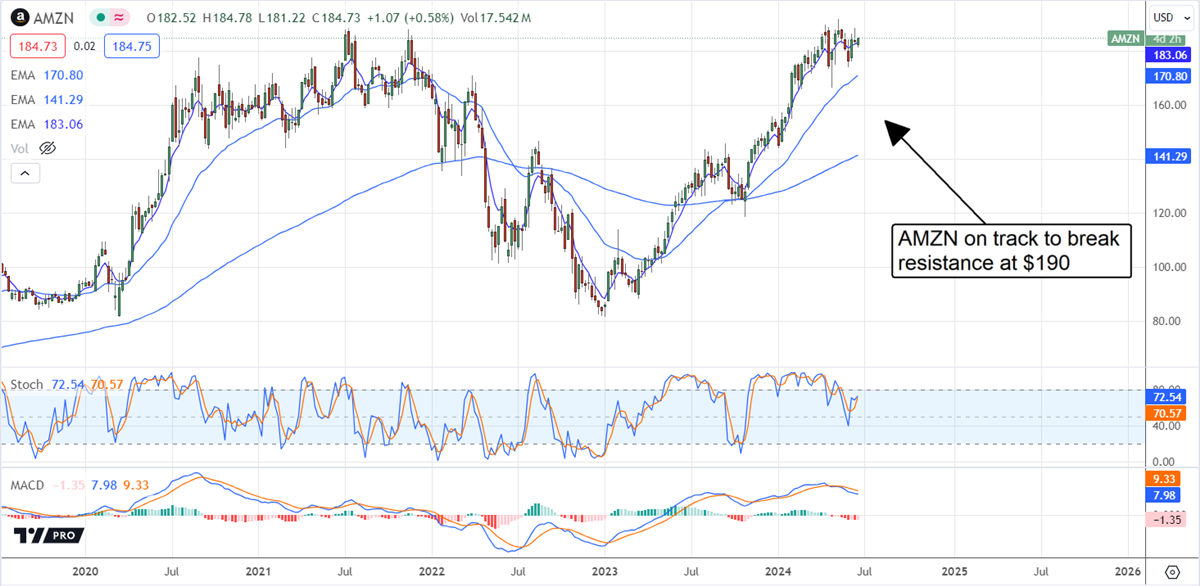
Amazon Stands Tall: Consumer and Cloud Business Boom
Amazon.com Today
$196.01 +3.84 (+2.00%) As of 04/2/2025 04:00 PM Eastern
- 52-Week Range
- $151.61
▼
$242.52 - P/E Ratio
- 35.44
- Price Target
- $260.53
Amazon stock stands tall, with strength in the consumer and cloud businesses that support its value. The stock is poised to set a new all-time high and it may come soon due to analysts' upgrades and price target revisions. The sentiment is up to Buy from Moderate Buy with a price target 17% above the current action. The analysts lead to the range's high end, good for another 1500 basis points of upside.
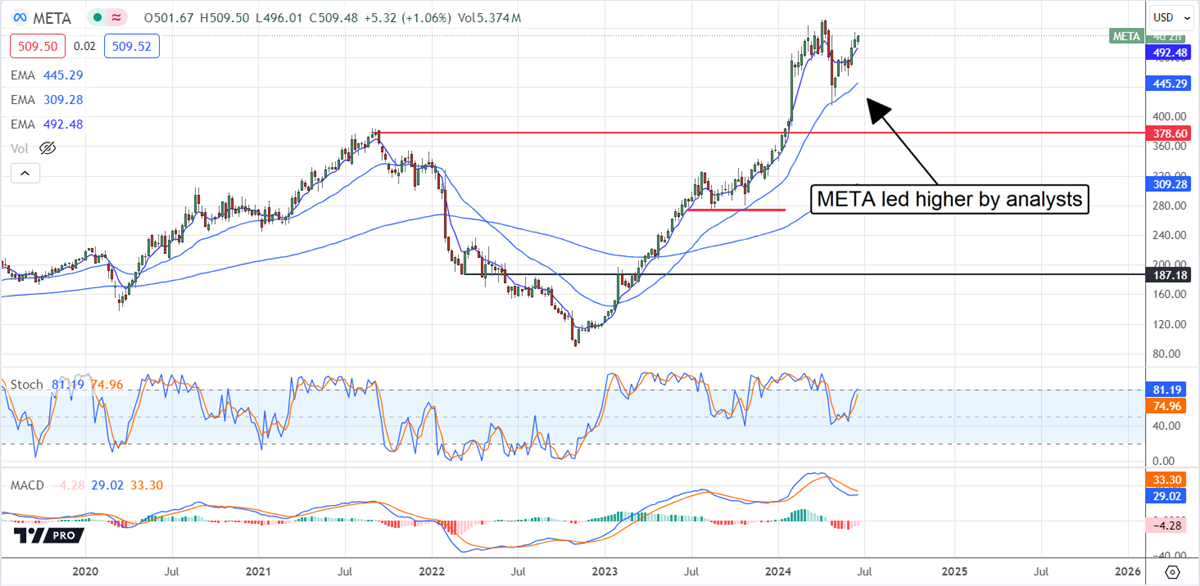
Meta Platforms Monetizes AI Like No Other
Amazon.com Today
$196.01 +3.84 (+2.00%) As of 04/2/2025 04:00 PM Eastern
- 52-Week Range
- $151.61
▼
$242.52 - P/E Ratio
- 35.44
- Price Target
- $260.53
Meta Platforms is working to advance AI, but the real story is how the business rebounded from its latest low, driven by efficiency and renewed user interest. User growth and engagement are up with the help of AI and driving wider margin and earnings leverage. The earnings strength led the company to initiate a dividend and aggressively repurchase shares, which helped support sentiment and the price action. The analysts also support the price action, lifting the consensus by more than 100% in the last twelve months. The consensus assumes fair value near the recent high, but revisions lead to the high-end range or about 17% upside.
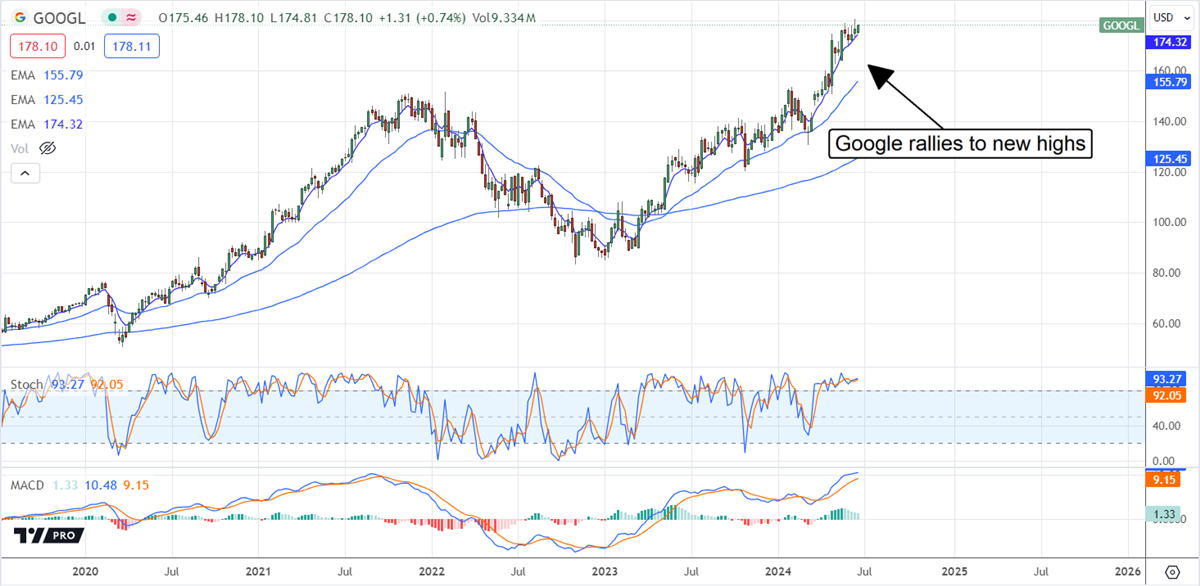
Google Parent Alphabet Gets Double-Billing
Alphabet Today
$157.04 -0.03 (-0.02%) As of 04/2/2025 04:00 PM Eastern
- 52-Week Range
- $147.22
▼
$207.05 - Dividend Yield
- 0.51%
- P/E Ratio
- 19.51
- Price Target
- $209.49
Google is ranked 6th in market cap weighting but also 7th because of its share class structure. The takeaway is that Google’s Class A and Class B shares account for 4% of the S&P 500 portfolio, and their price is indicated as higher. This year's trend in price target revisions has the consensus up 50% YOY and 10% above the recent price action. A move to the consensus would be an all-time high and likely lead to additional highs later in the year. Analysts expect revenue and earnings to continue growing at a double-digit pace this year and to sustain it next.
Before you consider Alphabet, you'll want to hear this.
MarketBeat keeps track of Wall Street's top-rated and best performing research analysts and the stocks they recommend to their clients on a daily basis. MarketBeat has identified the five stocks that top analysts are quietly whispering to their clients to buy now before the broader market catches on... and Alphabet wasn't on the list.
While Alphabet currently has a Moderate Buy rating among analysts, top-rated analysts believe these five stocks are better buys.
View The Five Stocks Here
Looking to profit from the electric vehicle mega-trend? Enter your email address and we'll send you our list of which EV stocks show the most long-term potential.
Get This Free Report
Like this article? Share it with a colleague.
Link copied to clipboard.