Read on to learn more about the financials services sector and eight top options in this industry.
Financial Services Stocks: An Overview
If you're like most Americans, you don't carry a pile of cash around with you when you go grocery shopping, and you probably didn't buy your home with cash, either.
Details like these are thanks to the financial services industry, which represents a series of company types focused around protecting investment funds and providing easier and safer access to money. For example, suppose you receive your paycheck through a direct deposit system. In that case, your bank and the company that transfers funds from your employer to your account are examples of financial service companies.
The financial services sector is a cornerstone of the American economy — some of the largest companies are within this sector when measured by market capitalization. Conglomerates represent many major stock options in the financial services sector, which usually offer multiple offshoots of financial services. When the economy is doing well, financial service stocks tend to also do well, as increased consumer spending and confidence lead to increased demand for financial services like loans and credit. Conversely, when the economy is doing poorly, these stocks also tend to suffer.
Understanding the Financial Services Industry
The financial services sector represents a broad range of businesses and institutions offering financial products and services to individuals and commercial operations. Financial services stocks are issued by companies that offer services such as financial transfers, banking services and investment management services.
Some of the types of companies that make up the financial services industries include the following:
- Banking: Banks are a central part of the financial services sector, offering services such as savings and checking accounts, loans, mortgages and other investment products. Commercial banks cater to individuals and businesses, while investment offerings in the bank sector focus on raising capital, facilitating mergers and acquisitions and providing advisory services.
- Insurance: Insurance companies offer various insurance policies to individuals and businesses to manage risks. Some examples include life insurance, health insurance and homeowners insurance, which can all offer some form of financial protection against sudden losses or major expenses.
- Investment services: Various companies provide investment services and management for retail and institutional investors. Some examples of businesses in this segment include brokers, mutual funds and hedge funds.
Some additional examples of companies in the financial services sector include credit unions, asset management companies, online lenders and forex firms. These companies work together to provide consumers with a full range of funding and money management services.
Why Invest in Financial Stocks?
So why should you consider investing with these top-rated companies? As the U.S. economy continues shifting away from traditional banking institutions and toward technology-driven solutions like cryptocurrencies, including Bitcoin, investing in financial services companies may not seem an obvious choice.
However, the reality is that these companies remain critical players in the market, even as new technologies and trends gain momentum.
Why?
First, buying the best financial stock can provide a reliable income stream. Many financial companies pay out dividends to their shareholders. Many financial stocks have demonstrated strong growth potential, making them appealing for long-term investment strategies.
Another reason to consider investing in financial stocks is the potential for increased profitability, meaning they could be the best stocks to buy when interest rates rise.
As interest rates rise, banks and other financial institutions will have more opportunities to earn profits.
Plus, the financial sector, besides being one of the sectors that benefit from rising interest rates, is essential to the overall health of the economy. No matter the ups and downs of the economy at large, financial companies provide necessary services such as banking, lending, financial planning and insurance, which people and businesses always need in good times and bad. As the economy grows and expands, the demand for these services increases and the potential returns for you if you choose to invest in them.
What is the Best Financial Stock to Invest in?
There is no one-size-fits-all answer to this question, as different stocks are more suitable for different investors. It all depends on your individual goals and risk tolerance. Factors such as a stock's dividend yield, price-to-earnings ratio and future growth prospects all factor in. Ultimately, it's up to you and/or your financial advisor to decide what is the best financial stock to buy.
Are Financial Stocks a Good Buy Right Now?
Financial stocks can be a good buy depending on your objectives and goals. These stocks perform well during economic growth, and many offer solid dividend yields and valuation metrics. And there may be opportunities to capitalize on rising interest rates and technological changes that could boost the top financial stock news. For these reasons, now may be a good time to consider investing in financial stocks if you have a risk appetite.
How to Choose the Best Financial Service Stocks
As you start to discover financial services stocks, you’ll notice that there are dozens of these types of companies trading on major exchanges. Some of the factors you may want to consider when comparing financial service stocks include the following:
- Net interest margin: Net interest margin (NIM) is a key metric for banks and other lending institutions, representing the difference between the interest income generated from loans and the interest expenses paid on deposits. A higher NIM generally indicates better profitability in lending activities, which can be a helpful figure when comparing bank and credit union stocks.
- P/E ratio: A company's P/E ratio compares its stock price to its earnings per share, helping you to assess whether a stock is overvalued or undervalued relative to its earnings potential. Comparing the P/E ratios of different financial companies can provide insight into their relative valuation.
- Return on equity: Return on equity (ROE) is a figure that measures a company's ability to generate profit from shareholders' equity. It's particularly relevant for financial companies, as they often use borrowed money to amplify their returns. A higher ROE suggests efficient use of equity capital, which may indicate more sustainable financial companies.
Remember that these data points are best used in conjunction with other corporate data. For example, when narrowing down bank stock prices and deposit rates, pull recent data from multiple competitors within a single period of time and compare them against one another. This can help guide your investment choices toward more sustainable options.
14 Best Financial Services Stocks
Now that you understand the basics of the financial sector and how it functions, you can start exploring banking stocks today. You may want to consider adding the following top financial service stocks to your portfolio.
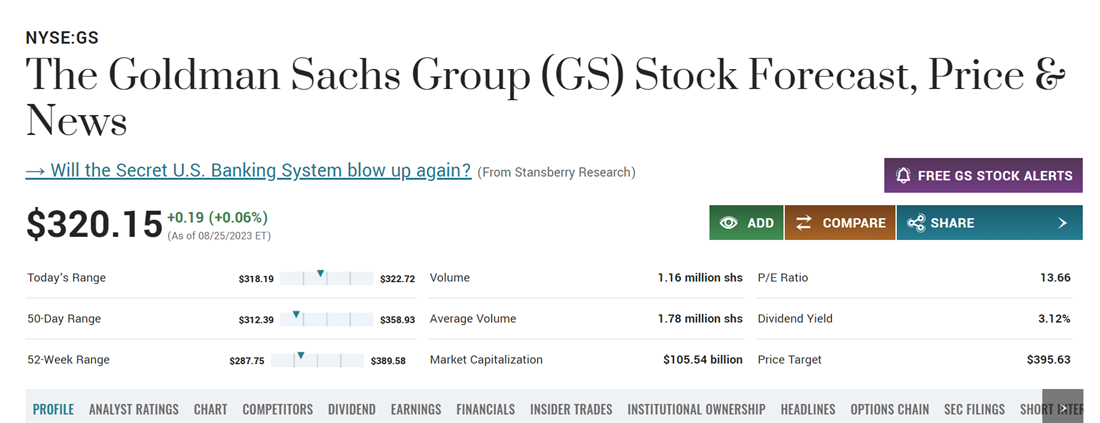
The Goldman Sachs Group
The Goldman Sachs Group (NYSE: GS) is a prominent financial services company operating in several sectors and a quintessential example of the investment offshoot of the sector. Founded in 1869, it established itself as a global banking and investment management authority. In August of 2023, the company had a total market capitalization of more than $105 billion, representing a highly diversified large-cap stock for investors.
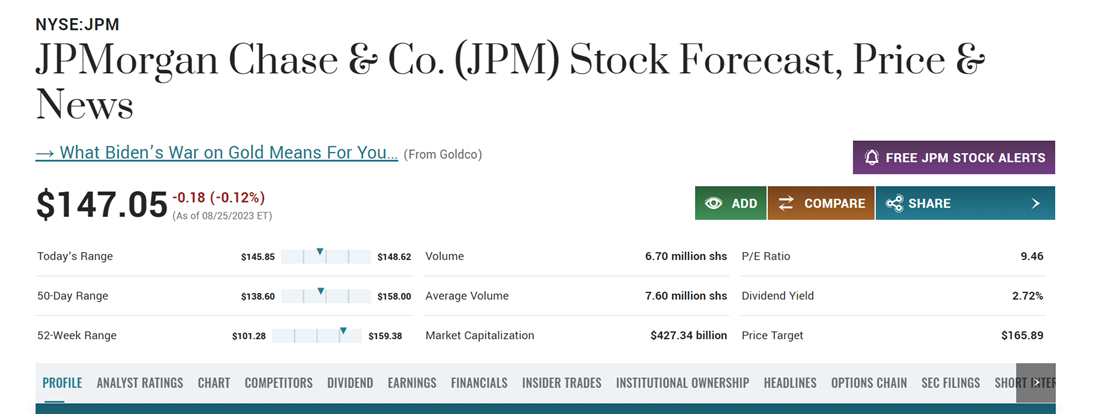
JPMorgan Chase & Co.
JPMorgan Chase & Co. (NYSE: JPM) is the fifth-largest bank in the world, and with a total market capitalization of more than $400 billion, it’s also a way to add mega-cap stability to your portfolio. JPMorgan operates in four primary sectors: consumer and community banking, commercial banking, asset and wealth management and corporate banking. With a highly diversified portfolio and a long history, JPMorgan Chase may be an appealing choice for long-term investors.
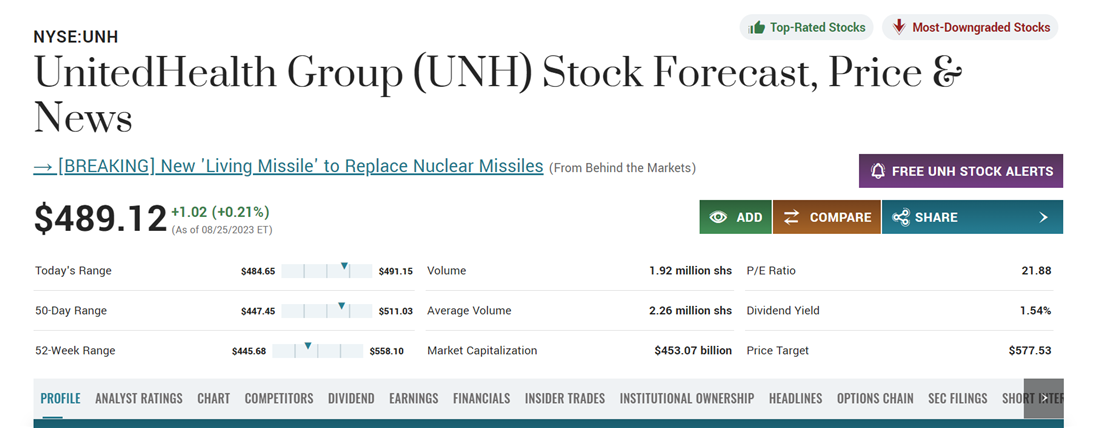
UnitedHealth Group
Investors looking to add exposure to the health insurance industry may want to consider UnitedHealth Group (NYSE: UNH), one of the most prominent insurers operating in the American Northeast. UnitedHealth has a long history dating back to the 1970s and has consistently paid dividends since the 1990s, making it a top blue-chip dividend stock with consistent payment increases.
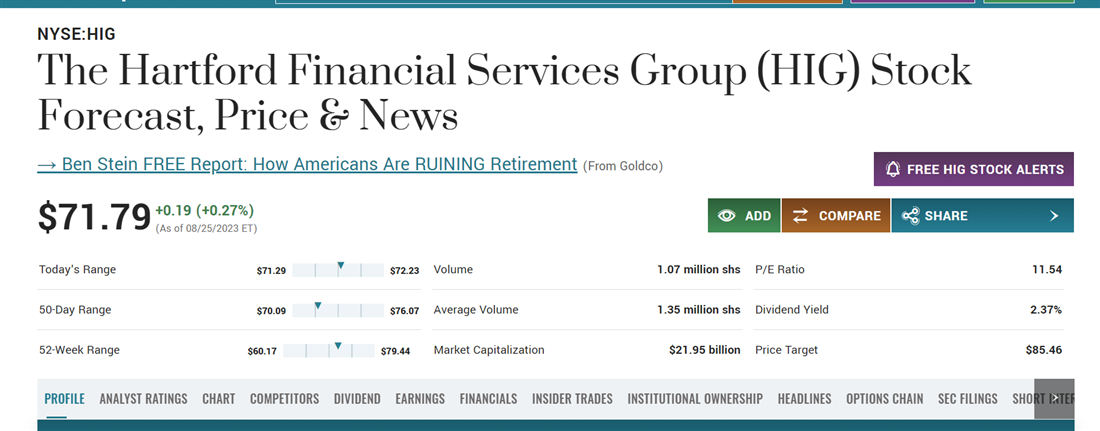
The Hartford Financial Services Group
An option for commercial insurance services, the Hartford Financial Services Group (NYSE: HIG) operates through four major segments: commercial insurance, personal insurance lines, wealth and asset management and group benefits. The Hartford has a strong financial foundation with a solid track record of financial stability and disciplined risk management, which can be an appealing point for long-term investors looking for companies likely to remain on the market for years to come. It also offers a dividend yield of more than 2.3%, making it a viable income-generating stock.
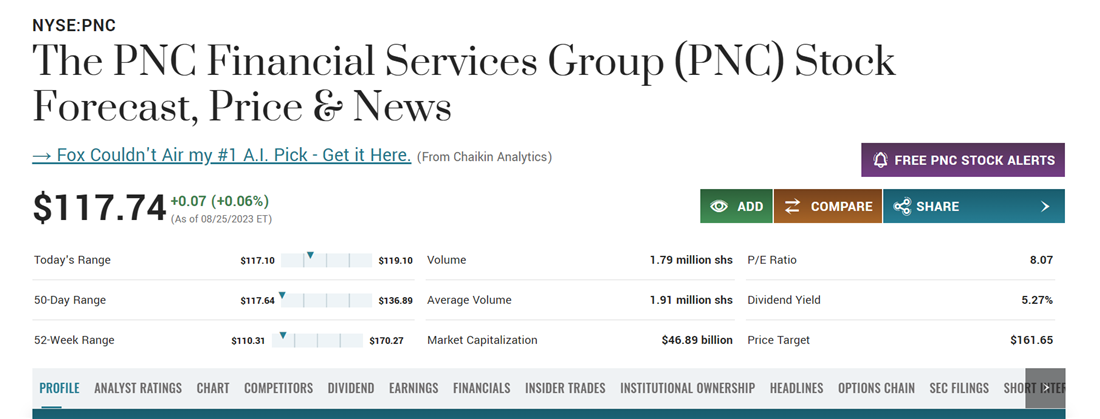
PNC Financial Services Group
A well-known retail bank, the PNC Financial Services Group (NYSE: PNC) operates a network of more than 2,300 branches throughout the Northeast. The company currently works in 19 states and the District of Columbia, offering financial services and products. The company’s products and services include retail banking, wealth management, corporate and institutional banking and residential mortgage banking. In August 2023, PNC Financial Services stock also showcased an exceptionally high dividend yield of 5.27%.
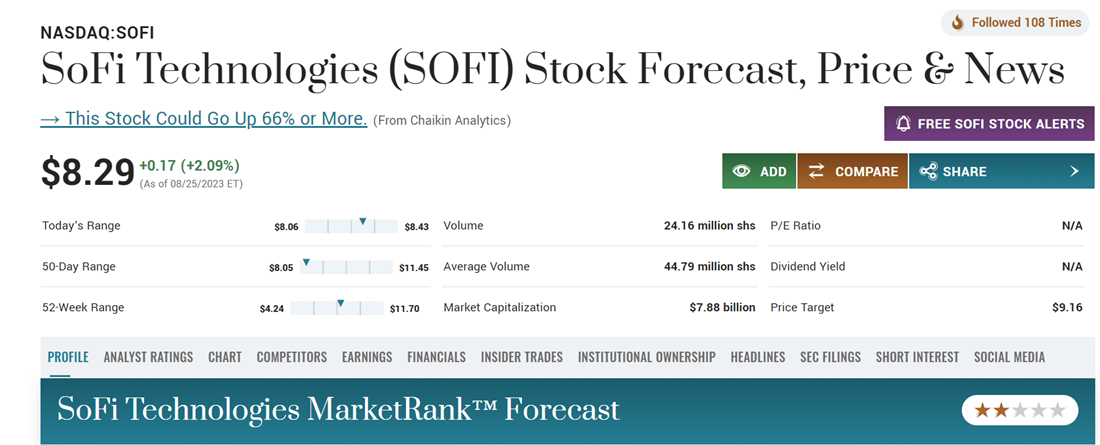
SoFi Technologies
If you're a tech-forward investor looking for a way to invest in financial services focusing on fintech, SoFi Technologies (NASDAQ: SOFI) could be worth exploring. Unlike most other options, SoFi does not maintain a brick-and-mortar presence. Instead, it offers services like mortgage and personal loan underwriting online. The company’s innovative and convenient business model has been well-received by consumers, and in August 2023, SoFi had a total market capitalization of $7.88 billion.
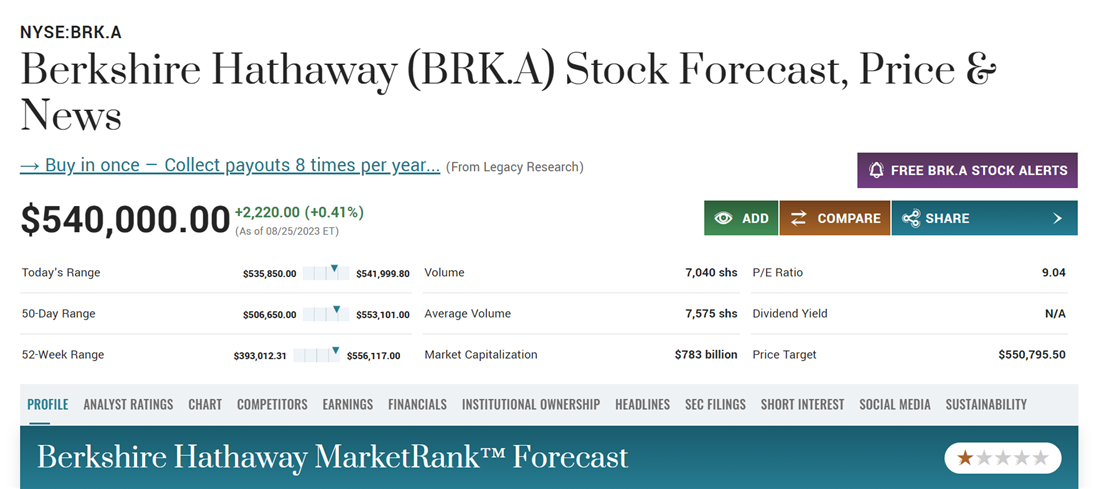
Berkshire Hathaway Inc.
Berkshire Hathaway Inc. (NYSE: BRK.A) is notable in the financial services sector for its decentralized business model, which engages in diverse services, ranging from investment advising to freight rail transportation. It qualifies as a financial services stock primarily through its many insurance segments. It also maintains significant investments in the rail transportation industry, offering a diverse option for investors.
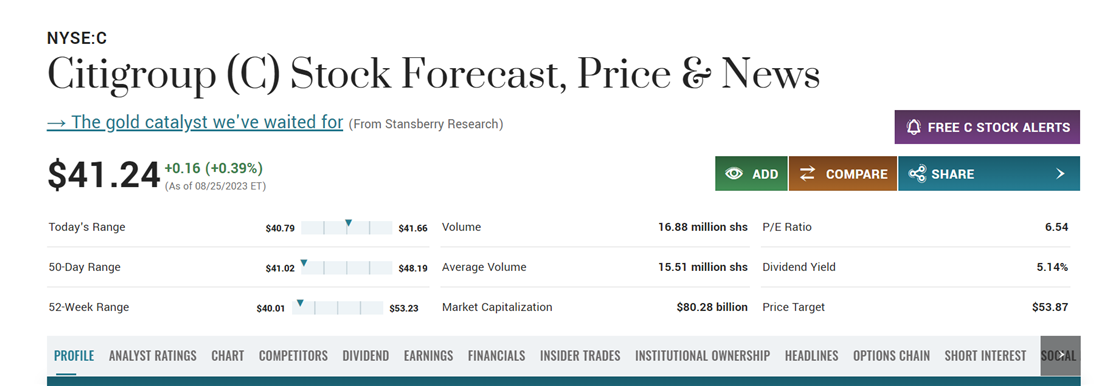
 Citigroup
Reported by Morningstar to be one of the most “undervalued U.S. banks,” Citigroup Inc. (NYSE: C) operates a large U.S. banking operation with international offshoots. Founded in the 1800s, it is also one of the longest-standing banks in the United States, initially considered one of the Big Four banks systemically important and "too big to fail." This large size may put Citigroup in a more advantageous position when compared to smaller regional operations.
American Express Company
American Express Company (NYSE: AXP) specializes in credit cards, payment processing and other financial services. The company has a strong reputation for quality customer service and offers a range of products for both consumers and small businesses.
The American Express dividend yield is around 1.4% and has a P/E ratio of roughly 17, so AmEx could be a good option. The company has demonstrated strong growth potential, with revenue increasing steadily over the past few years. In Q2 2023, it reported earnings that exceeded expectations, driven by a strong card business.
It's also made strategic investments in digital technology to serve its customers better and stay ahead of industry trends by launching a small business hub based on its acquisition of fintech company Kabbage. Analysts have given American Express a consensus "hold" rating due to its strong fundamentals and growth prospects.
Visa Inc.
Visa Inc. specializes in electronic payment solutions and technology. Its global network of payments gives consumers and businesses secure, fast and reliable transactions in over 200 countries. With a market capitalization of almost $500 billion, Visa is one of the largest payment networks in the world.
Regarding Visa financials, it has a P/E ratio of around 30 and a dividend yield of approximately 0.75%, which is lower than other financial stocks. However, it still represents a solid investment opportunity due to its potential for strong growth. The company reported solid earnings in Q2 2023, driven by growth in payment volume and processed transactions. Plus, with the rise of e-commerce and alternative payment methods, Visa is well-positioned to continue expanding its global reach. The company has invested in developing mobile payment solutions and integrating its platform with popular social media. Analysts have also given the stock a "moderate buy' rating due to its strong fundamentals and growth prospects.
Bank of America
Bank of America (NYSE: BAC) is a widely-known financial institution that provides a range of banking and financial services. Bank of America represents a solid investment opportunity with a P/E ratio of around 9 and a BofA dividend yield of approximately 2.8%. Its earnings in Q2 2023 were some of its strongest ever, driven by consumer banking and market business growth. The bank has made strategic investments in digital technology to better serve its customers and improve efficiency, with its mobile banking app receiving particularly high ratings from customers.
BofA analyst ratings are "hold" due to its strong fundamentals and growth potential. BofA financials are well-positioned to benefit with the economy recovering and interest rates rising. The company has also demonstrated its commitment to responsible lending practices, making it a top pick for a reliable financial stock with solid growth potential.
Morgan Stanley
Morgan Stanley (NYSE: MS) is a global financial services company that provides wealth management, investment banking and asset management services to clients worldwide. With a P/E ratio of around 15 and a dividend yield of approximately 3.8%, Morgan Stanley represents a potentially smart choice in stocks for rising interest rates.
The company has a strong reputation for innovation and has made major investments in tech. In fact, Morgan Stanley was one of the first traditional banks to embrace fintech, with its acquisition of E*TRADE in 2020. Its focus on digital transformation has paid off, with its wealth management business reporting strong earnings in Q2 2023.
Morgan Stanley analyst ratings are a "moderate buy" due to its solid fundamentals and growth prospects. Additionally, the company's acquisition and continued integration of Eaton Vance, a leading asset management firm, could further strengthen its position in the market. With its diversified business model and focus on innovation, Morgan Stanley is a top pick for long-term growth.
Wells Fargo & Company
Wells Fargo & Company (NYSE: WFC) specializes in wealth management, consumer and business banking, cash management, insurance, risk management and corporate trust. With a P/E ratio of around 11 and a dividend yield of around 3%, WFC could be a solid choice for a financial services stock to invest in now.
The company has over 4,00 branches and 12,000 ATMs across the US. Wells Fargo has an extensive presence in the consumer lending industry, making it a household name for many Americans. Although the company has faced some challenges in recent years related to its consumer banking practices, it's taken steps to address these issues and regain the trust of its customers.
In Q2 2023, Wells Fargo reported strong earnings driven by its commercial loans and credit business growth. The company has also made significant investments in its digital capabilities. Analysts have given Wells Fargo financials a "moderate buy" rating, with many seeing the potential for long-term growth as the company continues to recover. With its strong brand recognition and diversified business model, Wells Fargo is an appealing option if you're wondering which financial services company is the best.
Mastercard Inc.
Mastercard Inc. (NYSE: MA) is a global payments technology company that provides electronic payment solutions and transaction processing services worldwide. With a market capitalization of over $350 billion, it's one of the largest payment networks in the world.
In terms of Mastercard financials, the company has a P/E ratio of around 36 and a dividend yield of approximately 0.5%, which may be low compared to other financial stocks but still represents an attractive option due to its solid growth potential. The company reported strong earnings in Q2 2023, driven by growth in its processed transactions and cross-border volumes.
The company has invested heavily in its mobile payment solutions and made significant investments in blockchain technology via its Mastercard Multi-Token Network, which has the potential to revolutionize the payments industry.
Mastercard analyst ratings stand at "moderate buy" due to its strong financials and innovative payment approach. With its global network, commitment to innovation and solid growth prospects, Mastercard is a top pick with long-term potential.
How to Buy Financial Services Stocks
As you learn more about financial services stocks, you might want to add a few options to your portfolio. Use basic steps to buy insurance and bank stocks today and build wealth:
- Research brokerage account types and choose one that's best for your buying strategy and goals. Some common examples of brokerage accounts include 401(k)s, IRAs and taxable account options.
- Research individual brokers that offer the account type that you chose. Submit an application and wait for approval — most brokerages offer online account creation services, and you’ll usually be approved in a few minutes.
- Take some time to monitor and research financial services stocks. Track and compare data like P/E ratios and ROEs to determine which companies operate most efficiently in the sector.
- Link a funding method to your investment account. Depending on how you fund your account, you may need to wait a few days for the broker to verify that you own the account before transferring money between accounts.
- Choose how many shares to buy and place an order. If your broker can fulfill the order according to your instructions, you'll see your shares in your account.
- Remain dynamic as an investor and curious about the market, and monitor how your investments are changing in value over time. Create a plan for dividend reinvestment, and remember your long-term strategy when selecting an exit point.
You can view a more detailed explanation of buying your first stock share using MarketBeat’s guide.
Pros and Cons of Financial Services Stocks
Investing in the financial services sector involves benefits and risks that investors should know before proceeding.
Pros
The benefits include:
- Cyclical defensive potential: Different subsectors within the financial services industry may perform well in different economic cycles. For example, banks may benefit from economic growth, while insurance companies might offer stability during economic downturns. These features can enhance stability, leading to less drastic losses during market downturns.
- Dividend potential: Many financial services companies, especially banks and insurance firms, have a history of paying dividends. This can provide a consistent stream of passive income for investors.
- Global reach: Many financial services companies on our list operate internationally, offering exposure to global markets for you as an investor.
Cons
The downsides include:
- Risk of regulatory changes and intervention: The financial services sector is heavily regulated to ensure stability and consumer protection. Regulatory changes can impact business models and profitability, leading to volatility in your portfolio.
- Inherent sector volatility: Financial services stocks' performance is closely tied to economic conditions and market sentiment. Economic downturns can lead to credit defaults and reduced lending activity, leading to stock price volatility.
Outlook on Financial Services Stocks
According to research from Morningstar, the outlook on the financial services sector looks positive. In Q2 of 2023, Morningstar experts estimated that financial services stocks were trading at an average discount of 14% compared to their fair market valuation. However, it’s important to remember that financial services' stocks may more closely tie into overall economic health, which may present risks as mortgage rates and housing costs continue to taper consumer confidence.
A Focus on Financial Services
While stock market bank stocks, insurance stocks and stocks of other financial services may be market mainstays, it's important to remember that the insurance industry is competitive. Examining financial strength ratings of companies you're interested in can help protect you long-term against significant losses by limiting the chances of investing in a company that will default on its financial obligations. Investing in a financial exchange-traded fund over individual assets is another step you can take to diversify your holdings.